
By: Chuck Carnevale
07/06/2011
Earnings Yield the Foundation of Valuation
Individual companies derive their value from the amount of earnings and cash flows they are capable of generating for their stakeholders. The market will inevitably capitalize a publicly traded company’s shares based on the velocity and volume of earnings generated. A PE ratio of plus or minus 15 generally applies to the average company growing earnings between zero and 12% a year. The essence behind this valuation is the idea that any company that generates a profitable income stream is worth more than one times earnings.
In other words, if you owned a profitable business, you would expect a prospective buyer to pay you more than one times its annual earnings, even if it wasn’t growing. As long as the business is profitable, it has a value greater than its annual profits. From the seller’s point of view, why sell your business for only what it would generate for you over such a short timeframe. From the buyer’s point of view, a PE of 15 would imply a 6.66% return from the fixed earnings stream of a profitable company with no growth. Of course, if earnings were growing, the future return would also grow along with earnings.
This principle relates to how a fixed income instrument has a value greater than its annual interest payment. An 8% bond trades at 12 1/2 times interest, a 6% bond would trade at 16.66 times interest. Consequently, if you paid 15 times earnings to buy a company with even a modest level of growth, for example 6% to 8%, your growing income stream should compensate you at a greater level than you would expect from a fixed income instrument. Of course, there is generally more risk with owning the equity than with owning most fixed income instruments.
The bottom line with this discussion is that rational buyers and sellers of businesses, publicly traded stocks included, will ultimately focus on earnings yield. This is the return that the business is generating based on the profitability of its operations. Therefore, valuations will ultimately have to make sense based on the return reality that the company’s earnings offer. This is how it should logically work, and why the value of the average publicly traded company inevitably reverts to the mean PE of 15.
Historical Insights
The principles discussed above apply equally to a group of companies like a market index, as they do to a single company. However, these principles only apply when investors are behaving rationally. This implies that investors are actually running the numbers and calculating the return that the earnings are offering. Unfortunately, investors often allow the emotions of either fear or greed to override reason. When this occurs, emotionally charged markets can ruefully misprice stocks over short periods of time. The prudent investor always runs the numbers and therefore can recognize pricing anomalies when they occur.
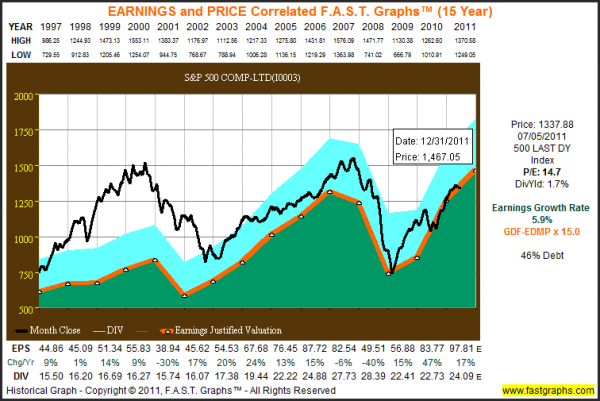
The following 15-year earnings and price correlated F.A.S.T. Graphs™ on the S&P 500 vividly illustrates market mispricing and how it corrects itself. The orange line with white triangles plots S&P 500 earnings per share since 1997 multiplied by its historically normal PE ratio of 15. The light blue shaded area represents dividends paid out of earnings, the green shaded area. There are several important insights that can be gleaned from this graph.
First of all, the irrational exuberant period (1997 to 2000) dramatically overvalued the S&P 500’s growing earnings. This led to the inevitable correction that was triggered by the recession of 2001. When S&P 500 operating earnings fell, stock prices followed. The significant overvaluation that culminated in calendar year 2000 greatly explains the so-called lost decade for the S&P 500. However, as earnings recovered from calendar year 2002 through 2007, the S&P 500’s stock price followed its rising earnings.
Then of course the great recession of 2008 brought both S&P 500 earnings and stock prices tumbling down. The sobering effect of this great economic catastrophe appears to have caused investors to finally, and once again, behave more rationally. It’s interesting to note that S&P 500 stock price never really breached the normal PE ratio of 15, and how closely price is tracking earnings at this level in 2010 and 2011. Much of what this graph depicts is in conflict with many investors’ views of what occurred over the last decade and a half with the stock market.
The S&P 500 current blended PE ratio of 14.7 implies that the S&P 500 is currently fairly valued to only slightly under-valued. Moreover, based on the current estimates for year-end 2011 earnings it would appear that the market still has room to advance this calendar year. The valuations for this year and next will be calculated and discussed in the final paragraph of this article.
Long-term Performance – a Function of Earnings Growth and Valuation
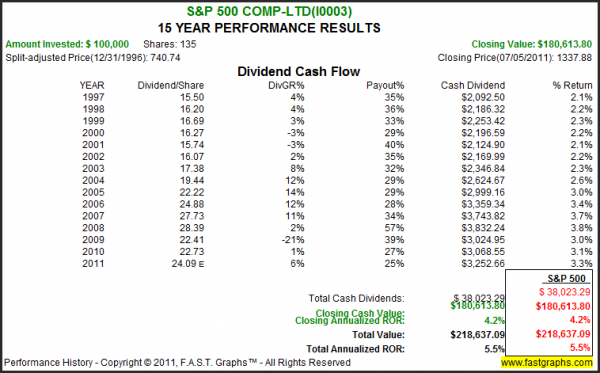
When you review the calculated performance results associated with the above graph, the importance of earnings and valuation are further validated. From the dividend cash flow table we learn that the average company, as measured by the S&P 500, cut their dividends during both recessions (2001 and 2008) as earnings dropped. We also discover that capital appreciation of 4.2% (closing annualized ROR) correlates to long-term earnings growth of 5.9%. Returns were adjusted downward by beginning overvaluation. Nevertheless, the importance of earnings cannot be denied.
Looking to the Future
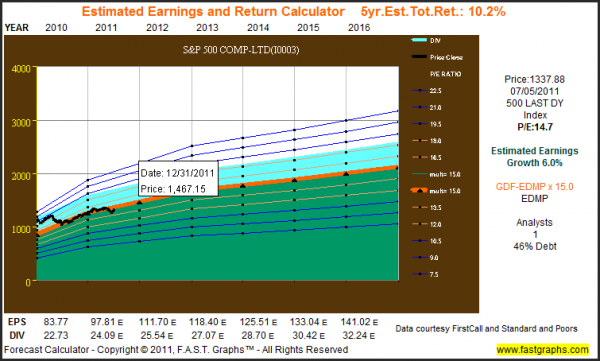
Taken directly from the Standard & Poor’s website, the estimated earnings of the S&P 500 for calendar year 2011 are $97.81. If you multiply those earnings by the historically normal PE ratio of 15 (the orange line on the graphs) the estimated value for the S&P 500 by year-end 2011 is 1467 (see flag on graphs). The estimated earnings figure for calendar year 2012 is currently $111.73. Multiply this estimate on historical normal PE ratio of 15 derives an estimated 2012 value for the S&P 500 1676. If these earnings estimates prove accurate there is no reason not to believe that those valuations will not be met.
Disclosure: No positions at the time of writing.
Disclaimer: The opinions in this document are for informational and educational purposes only and should not be construed as a recommendation to buy or sell the stocks mentioned or to solicit transactions or clients. Past performance of the companies discussed may not continue and the companies may not achieve the earnings growth as predicted. The information in this document is believed to be accurate, but under no circumstances should a person act upon the information contained within. We do not recommend that anyone act upon any investment information without first consulting an investment advisor as to the suitability of such investments for his specific situation.

