The first leading indicator I learned was the “bellwether” of GM. At that time it had out used in usefulness, yet its usefulness was clear. Back in the 50’s and 60’s it was a rule: “the way GM goes so goes the market.” The performance of a bellwether stock is said to reflect the performance of the industry, if not the economy in general. These industrial groups are used as barometers for the rest of the market. Back 50 years ago it was GM in more recent days they say its JP Morgan Chase or Microsoft. In any event, the trader can use a leading indicator to stay in front of the curve – be on the front foot.
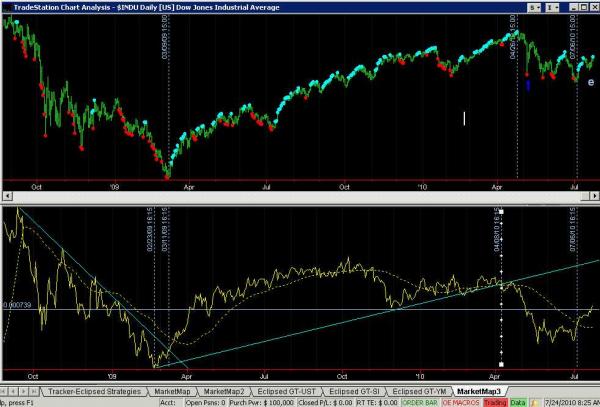
The chart below is my leading index chart posted below the daily Dow Jones. A casual review should give you an idea of how it keeps me – my clients – ahead of the pack.
In the past week this leading indicator has finished basing, had a bullish breakout from a head and shoulder bottom, moved above its moving average, broken back above resistance and is trending higher. Meanwhile, if the trader was only looking at the stock indices he would see a stock market still locked in a trading range.
My leading indicator’s breakout calls for higher a stock market. It is in gear with my MarketMap™. On its last change of trend date (COTD) July 6th low the map called for a rally in the month of July. MarketMap™ next COTD to will be announced.