
This is what I see in the Forex starting the week of August 16th – an OPINION ONLY: www.proacttraders.com
I do these three currency pairs because they represent a cross section of the market as a whole – all matching up to possible opportunities on Wild Card, 6 Aces and Royal Flushes (Trending and Elliott Wave) and they represent correlating other currencies.
Example: due to it’s very close correlation the EURUSD will show you what the USDCHF will possibly do going the other way!
This way whatever trader you are you have an idea of what the possibilities might be.
REMEMBER: THIS IS BIG PICTURE ONLY – NOT INTRADAY! Please NOTE!!!! This is an opinion only!
What I see…the currencies MIGHT do next week? NOTE: IF YOU ARE UNSURE – STAY ON THE SIDELINES!’
SPECIAL NOTE: Written by John Kicklighter, Currency Strategist
After an exceptionally volatile period for the currency market, the Canadian dollar came through as a significant loser this past week. Culled sentiment was clearly a factor with the Japanese yen appreciating an astonishing 4.38 percent against the loonie; but that wasn’t the full story. A critical look shows us that the currency actually closed the week lower against all its major counterparts (including follow commodity bloc members Australian and New Zealand dollar). While fundamental traders should keep track of risk appetite and the commodity correlation going forward; there are more provoking concerns building under the surface that could spark a trend in the otherwise anchored USDCAD sooner rather than later.
CLICK ON IMAGES TO ENLARGE
——————————————————————————–
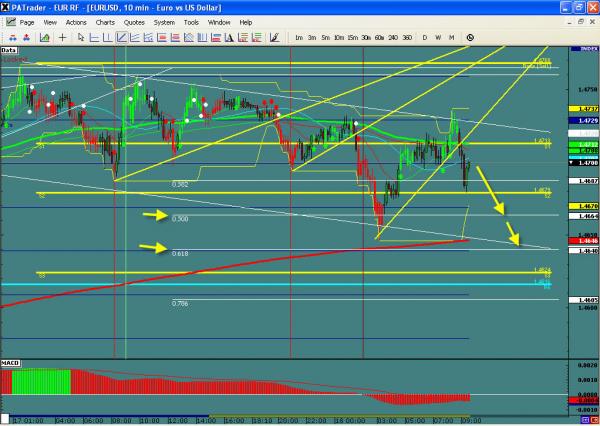
EURUSD
WHAT I SEE: The downside target for the EURUSD was the 1.4216 level. The low did reach 1.4160. The level corresponds with the 50% fibo of the move up from the August 12th low. Below this level is a congestion area with the .618 fibo, the previous resistance now support and the R5 all in the 1.4150 ish level. Buyers may come in against this level with initiating selling on a break back below. A move below targets 1.3966 next .
——————————————————————————–
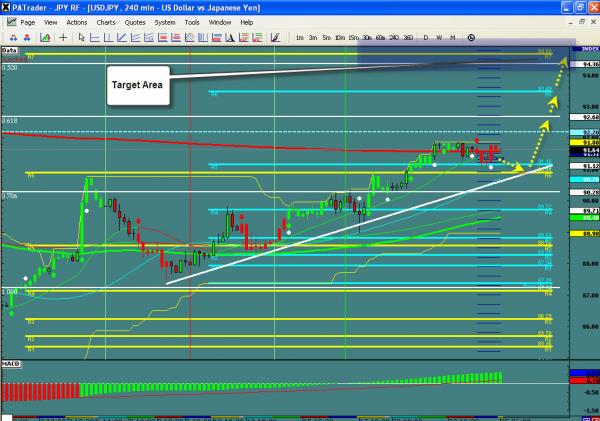
USDJPY
WHAT I SEE: – The USDJPY continued down to the 94.44 target level. The next level comes in at the 94.02 where the S5 of the bigger move and the .618 fibo are. This move down is extremely well structure.. Looking for completion of the move to 94.02 and then bounce then. Will have to see if that is it to the downside in the first part of the week. If a continuation happens will look to the next target at 93.04
——————————————————————————–
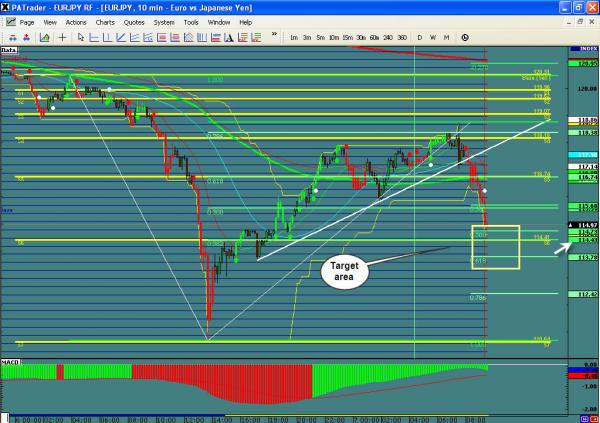
EURJPY – ALWAYS MY PREFERRED TRADE!!!!!
WHAT I SEE: – The EURJPY is back down testing the 38.2% retracement support at the 134.28 level and this is a former bottom. A break will target the 133.00 level where the .500 fibo is located. The move lower is targeted for the S5 at 132.66 and I would look for a bounce there just due to profit taking. Target below that is 132.00 – 131.77
——————————————————————————–
EXTREME CAUTION IS URGED – TRADE WITH STOPS!!!!!
BTW – if you want to save the pics, right click and hit “save as”.
IMPORTANT NOTICE: These comments are for information purposes only. The information contained on this document does not constitute a solicitation to buy or sell by ProAct Traders, LLC., and/or its affiliates, and is not to be available to individuals in a jurisdiction where such availability would be contrary to local regulation or law. Opinions, market data, and recommendations are subject to change at any time. Forex trading involves substantial risk of loss and is not suitable for all investors. This is an opinion ONLY – and not a trade call, but a study that may lead you to a trade. I do not know whether this will transpire or not so use your own judgment.

