
EURUSD, USDJPY, EURJPY -I do these three currency pairs because they represent a cross section of the market as a whole – all matching up to possible opportunities on Wild Card, 6 Aces and Royal Flushes (Trending and Elliott Wave) and they represent correlating other currencies.
Example: due to it’s very close correlation the EURUSD will show you what the USDCHF will possibly do going the other way!
This way whatever trader you are you have an idea of what the possibilities might be.
REMEMBER: THIS IS BIG PICTURE ONLY – NOT INTRADAY! Please NOTE!!!! This is an opinion only!
SPECIAL NOTE:
http://easez.wordpress.com/
CLICK ON IMAGES TO ENLARGE
——————————————————————————–
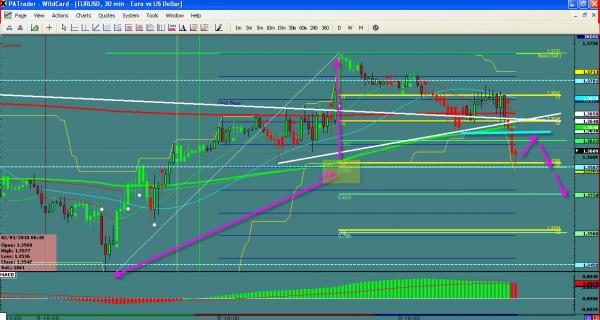
EURUSD
WHAT I SEE: Looks like we are definitely in the Wave 3 south ( seen on the 240 chart) . And that is usually larger then wave 1. Looking for a target of 1.400o area initially and then further move south. Our initial target is 1. 3937 with follow through to 1.3849 – 1.3731 area. Should have some profit taking at the 1.3971 area ( S6) 1.4000 area if not a bounce to start wave 4 up. Waiting for the bear flag break to add to positions.
——————————————————————————–
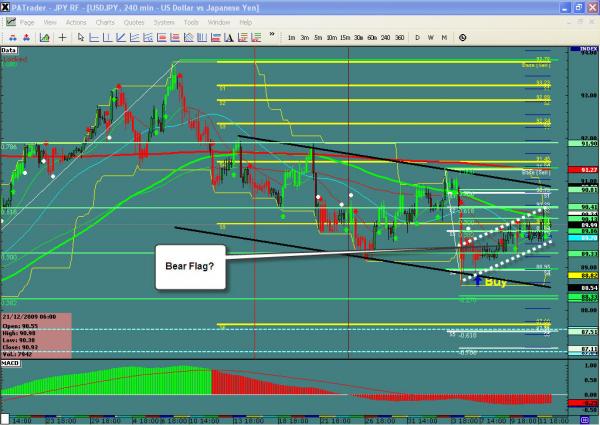
USDJPY
WHAT I SEE: – The price did not take out the .500 fibo last week and turned on the .382. Japan has real fundamental problems so this will be interesting this week. Currently sitting on DAY support at 98.87 which could propel it north, but a break below here could drop to 87.36 ( next day support). There is a large consolidation area which it broke out of so not out of the question to come back and tag this. If it does break south we would target the 0.618 Extension at 88.17 and then the S6 HSI target at 87.36. Not particularly well structured so I would wait for clear signals each way.
The pair has formed a wedge at this level with lows progressively getting higher. Typically with a pattern such as this, the market will force the pair to break out in one direction or another. The bias based on the Daily charts is to the downside.
——————————————————————————–
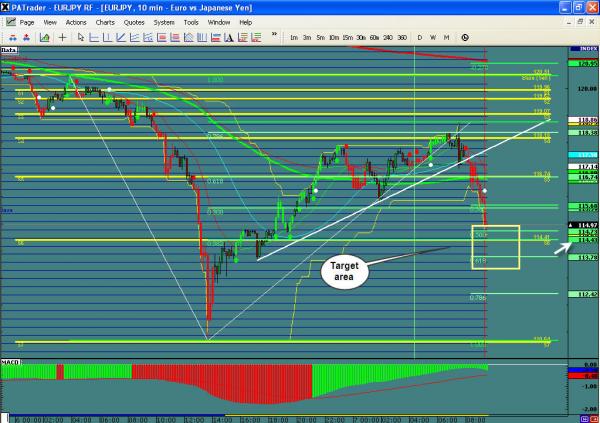
EURJPY – ALWAYS MY PREFERRED TRADE!!!!!
WHAT I SEE: – I wrote last week: Looking to continue the short bias to the .786 fibo at 129.00 area. Further target is a double bottom.
We area at the double bottom (actually this support is multiple times on the day chart). This is a pretty long unabated move with no significant pullback so this is a great place to do one. Should see a pullback or consolidation here and then a breakout of current support to the 124.51 (S7 area) with further targets at 122.10-34 area.
——————————————————————————–
EXTREME CAUTION IS URGED – TRADE WITH STOPS!!!!!
BTW – if you want to save the pics, right click and hit “save as”.
IMPORTANT NOTICE: These comments are for information purposes only. The information contained on this document does not constitute a solicitation to buy or sell by ProAct Traders, LLC., and/or its affiliates, and is not to be available to individuals in a jurisdiction where such availability would be contrary to local regulation or law. Opinions, market data, and recommendations are subject to change at any time. Forex trading involves substantial risk of loss and is not suitable for all investors. This is an opinion ONLY – and not a trade call, but a study that may lead you to a trade. I do not know whether this will transpire or not so use your own judgment.

