
This is what I see in the Forex starting the week of Sept 13th – an OPINION ONLY: www.proacttraders.com
I do these three currency pairs because they represent a cross section of the market as a whole – all matching up to possible opportunities on Wild Card, 6 Aces and Royal Flushes (Trending and Elliott Wave) and they represent correlating other currencies.
Example: due to it’s very close correlation the EURUSD will show you what the USDCHF will possibly do going the other way!
This way whatever trader you are you have an idea of what the possibilities might be.
REMEMBER: THIS IS BIG PICTURE ONLY – NOT INTRADAY! Please NOTE!!!! This is an opinion only!
What I see…the currencies MIGHT do next week? NOTE: IF YOU ARE UNSURE – STAY ON THE SIDELINES!’
SPECIAL NOTE:
EURUSD moved through the 2009 high at 1.4447. The GBPUSD moved through important resistance at 1.6589. The USDCHF fell through 2009 lows at 1.0531, USDJPY fell through the summer low of 91.72 and the AUDUSD and NZDUSD moved to 2009 highs as well. No stones were left unturned from a chartest standpoint and to have it start the 1st week of the last 1/4 of the year, after a non-trend period, helps the bearish picture. Greg Michalowski
CLICK ON IMAGES TO ENLARGE
——————————————————————————–
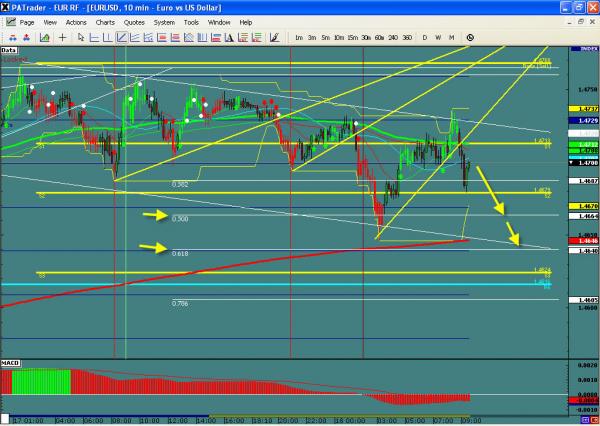
EURUSD
WHAT I SEE: The EURUSD has moved above the R5 at the 1.4571 level and is now at the Day chart resistance at 1.4626. We also have a rising wedge which normally indicates a fall. If it respects the 1.4526 level look for a retracement to the 1.4501 level (MA). Due to the dollar selling bias though it very well may break out north – look for the 1.4800 area ( R6)
——————————————————————————–
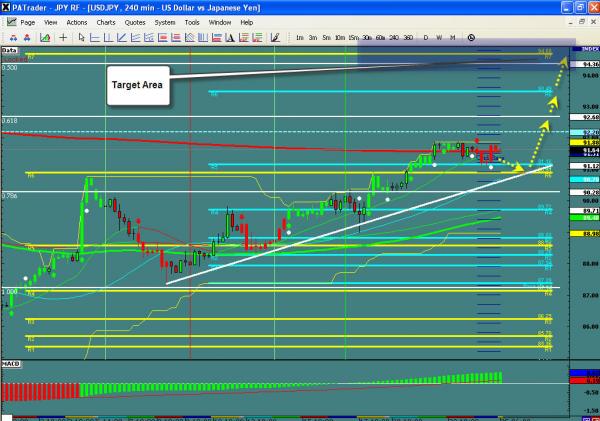
USDJPY
WHAT I SEE: – The USDJPY continued down past the 91.81 target – this is now the upside resistance . We have continued the clear down trend in place and stopped at the .786% Fibo and bounced so it will depend on what traders do with the dollar. There is a strong support at 89.64 form the day chart. If we continue south look for a move to the S7 at 87.93.
——————————————————————————–
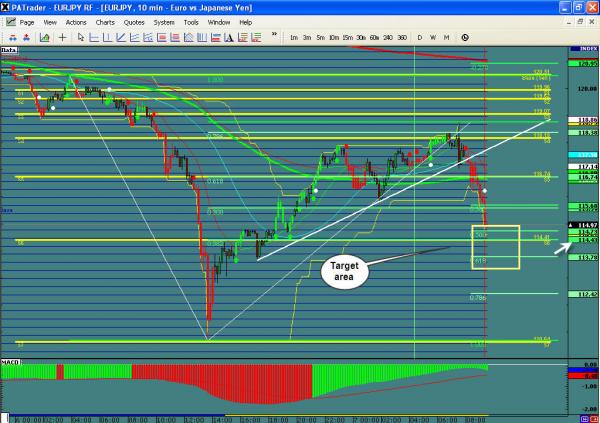
EURJPY – ALWAYS MY PREFERRED TRADE!!!!!
WHAT I SEE: – The EURJPY is still headed south breaking two key supports. Look to the 131.00 area ( former Sept 2 close) for clues – I would expect a bounce here as buyers come back in but there is a trendline and S7 target still below.
——————————————————————————–
EXTREME CAUTION IS URGED – TRADE WITH STOPS!!!!!
BTW – if you want to save the pics, right click and hit “save as”.
IMPORTANT NOTICE: These comments are for information purposes only. The information contained on this document does not constitute a solicitation to buy or sell by ProAct Traders, LLC., and/or its affiliates, and is not to be available to individuals in a jurisdiction where such availability would be contrary to local regulation or law. Opinions, market data, and recommendations are subject to change at any time. Forex trading involves substantial risk of loss and is not suitable for all investors. This is an opinion ONLY – and not a trade call, but a study that may lead you to a trade. I do not know whether this will transpire or not so use your own judgment.

