

The Australian dollar seems to have become one of the most hated currencies in 2013, with the Currency Shares Australian Dollar ETF ($FXA) off nearly 8% YTD. Last month I wrote about the drop in the currency from down under, discussing some of the warning signs and a possible support level. Bears were able to maintain control while keeping pressure on $FXA as it broke support and headed lower.
While the waterfall hasn’t been turned off, there are some bullish notes that are beginning to develop on the chart and in the sentiment data for the Aussie Dollar. The drop in 2012 looks very familiar to the move we’ve been experiencing this year. Since price has fallen to last year’s low we are going to compare the similarities between the bottom in ’12 and where we currently sit.
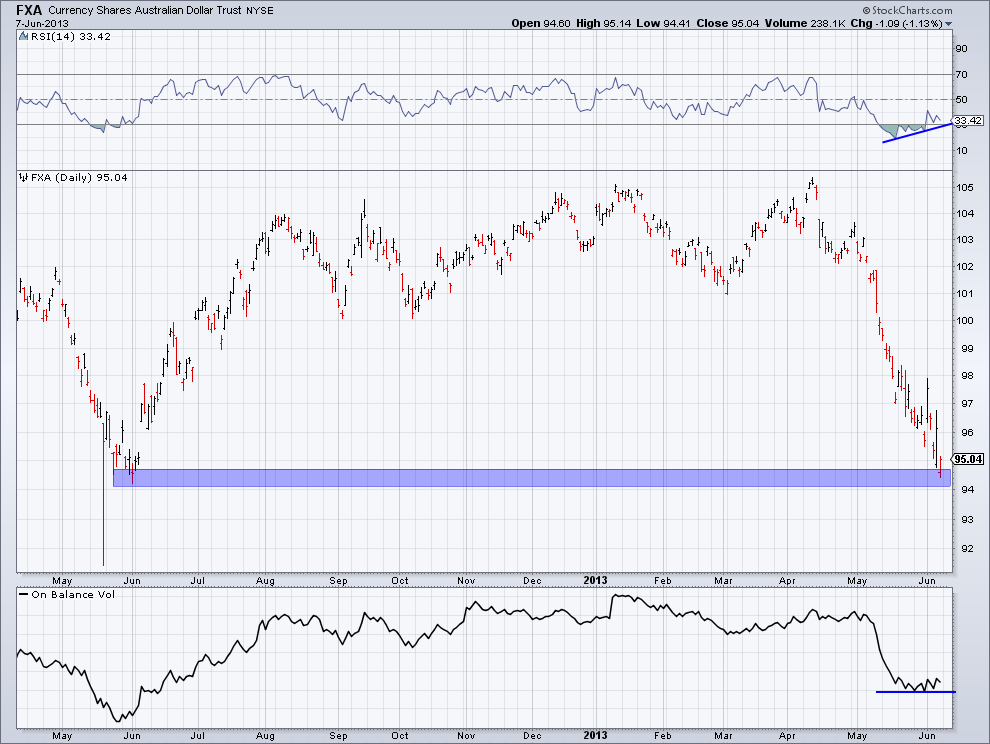
MOMENTUM DIVERGENCE
First up is the divergence taking place in the Relative Strength Index (RSI). Like last year, momentum became oversold and stayed oversold for the bulk of the drop. However, during the last week as price has continued to contract, RSI has been rising and eventually made its way back above 30.
ON BALANCE VOLUME
Next up is On Balance Volume, which simply adds and subtracts the volume on up days and down days, giving us an idea of buying and selling pressure within the price action of a specific security, is also showing possible signs of buyers stepping in. Since mid-May, On Balance Volume appears to have bottomed and has risen slightly against the headwinds of price contraction, which also happened when price bottomed in June ’12. This shows that while prices have been heading lower, the volume on up days is stronger than that of down trading days.
CFTC COT DATA
Finally, we have the latest set of Commitment of Traders data. In my piece last month I mentioned that Commercial Traders (the ‘smart money’) are rarely net-buyers of the Australian dollar. During this latest period of weakness the Commercial Traders have been stepping in, taking their total position to the highest net-long in the last nearly four years as Large Traders (mostly hedge funds) and Small Traders (individual traders) have become extremely net-short.
BOTTOM LINE
While momentum, volume, and COT data appear to be setting up for the bulls to take the reins, there is a steep mountain for them to climb in order to reverse the current down trend. We’ll see if these early signs of reprieve continue to play out and if $FXA is able to found a bottom among this bullish set of data.
Don’t miss the Summer edition of the TraderPlanet Journal. Start reading it here.
Disclaimer: The information contained in this article should not be construed as investment advice, research, or an offer to buy or sell securities. Everything written here is meant for educational and entertainment purposes only. I or my affiliates may hold positions in securities mentioned.

