
Before you can get to where you want to go, you have to know where you are.
Since 1989 we have compiled cycle studies of the stock markets. Going back in history over 100 years of data to come up with a map for each year in terms of overall direction and dates when to expect tradable changes. In the latter case we are referring to change of trend dates (COTD) where meaningful bottoms or tops should be expected. MarketMap™ allows traders to play long and short strategies based on their own money management rules. It also lets system traders to turn on one sided trading or trade more contracts on the one side. Below you will find our map for the first half of 2010.
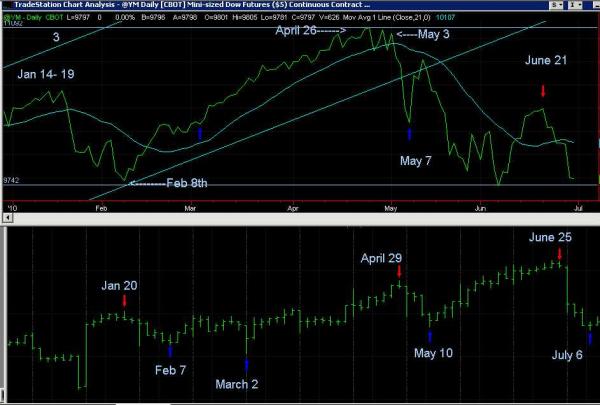
In the chart below, you can see, I am expecting a tradable low on the 6th of July +/- 1 day. With Monday being a holiday, the low may set up as early as Friday. Prices are expected to move higher in July.
Jack F. Cahn, CMT
TraderAssist®
Since 1989, Creative Breakthrough, Inc. CTA
Copyright 1989-2010

