
To V or not to V, That is the Question
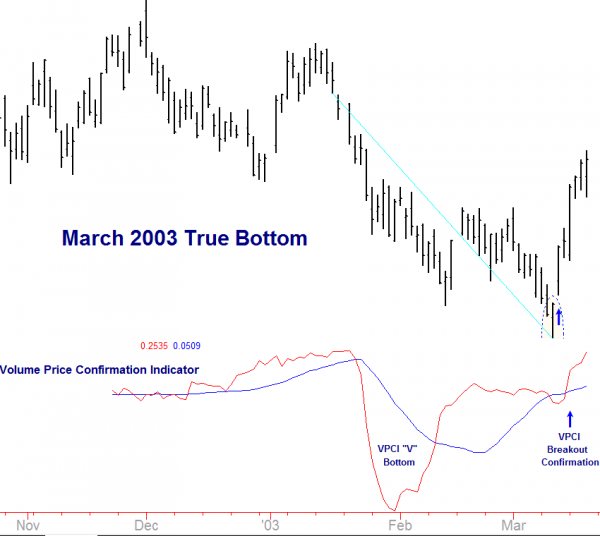
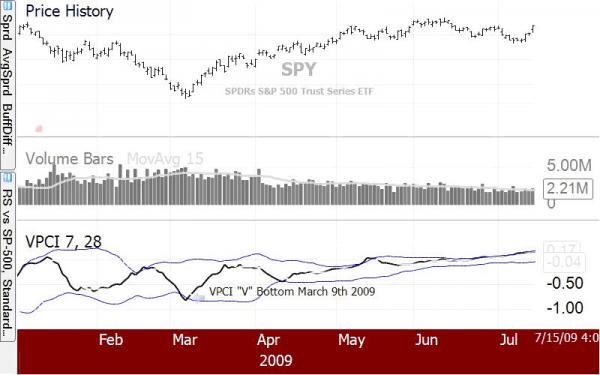
In our last commentary we pointed out that the market (as identified by the SPY) was deeply oversold on a price-volume basis. This pattern is marked by the VPCI (Volume Price Confirmation Indicator) falling two standard deviations below a Bollinger Band of itself. When the VPCI turns back up and crosses above the lower Bollinger Band, the market has then capitulated. Notable incidents of such an occurrence were March 12th 2003, March 9th 2009 and most recently October 5th, 2011.
“V” Bottom March 12th, 2003
“V” Bottom March 2009
“V” Bottom October 2011
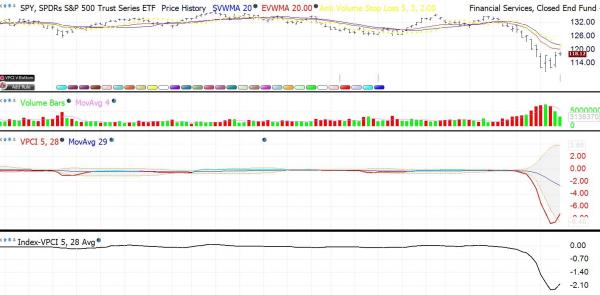
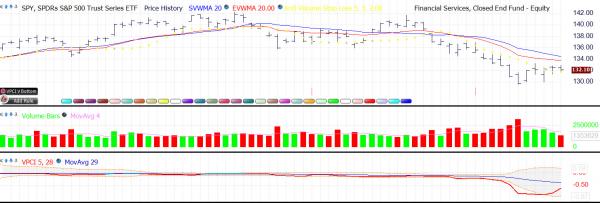
So are we there yet? Take a look at the chart below. Notice the VPCI has crossed over the lower Bollinger Band. So yes,by definition technically we are here. However, in other VPCI “V” signals the indicator has turned up. This time the indicator has moved sideways as opposed to turning sharply up to form the classic “V” shape. This looks more like “L” than a “V”. Meanwhile, the last three days the market has put in near dojis. Although, not technically dojis, they are close. Doji are notorious for indecision. When located within a trend a doji may signal an ending to that trend. An interpretation could be that the market wants to reverse and turn back up. But so with so much indecision, a low vix, and an “L” bottom, investors may want to keep some powder dry.
March 24th “V”, “L”,or “U” Bottom
Capital Weighted Indexes created on StockFinder, subscribe here: http://volumeanalysis.com/ & click StockFinder
Definitions:
Capital Weighted Volume – This is the true volume of an index. It is calculated by summing the volume of each individual index member in proportion to its weighting the index.
Capital Weighted Up Volume – The capital weighted volume of securities closing higher.
Capital Weighted Down Volume – The cap weighted volume of securities closing lower.
Cumulative Cap Weighted Volume – A running total of the cumulative net of CW-Up versus CW-Down Volume.
AVSL Anti-Volume Stop Loss – Proprietary formula taking into account support, volatility and the inverse of price-volume’s asymmetrical relationship.
VPCI Volume Price Confirmation Indicator – measures the asymmetrical relationship between price and volume over the course of time and trends.
VW-MACD – Volume Weighted Moving Average Convergence Divergence
TTI – The Trend Thrust Indicator is an adaptive trend indicator taking both price and volume moments into its logic.
VPCI Indexes – The average VPCI score of each individual index component.
VPCI “V” Bottom – A capitulation signal occurring when the VPCI has fallen two standard deviations below a moving average of itself and then pops back above the lower standard deviation band (Bollinger Band).
For more information on Capital Weighted Volume/ VPCI Index:http://www.traderspress.com/detail.php?PKey=950&affiliate=volumeanalysis)
Disclaimer:
Definitions:
Capital Weighted Volume – This is the true volume of an index. It is calculated by summing the volume of each individual index member in proportion to its weighting the index.
Capital Weighted Up Volume – The capital weighted volume of securities closing higher.
Capital Weighted Down Volume – The cap weighted volume of securities closing lower.
Cumulative Cap Weighted Volume – A running total of the cumulative net of CW-Up versus CW-Down Volume.
AVSL Anti-Volume Stop Loss – Proprietary formula taking into account support, volatility and the inverse of price-volume’s asymmetrical relationship.
VPCI- Volume Price Confirmation Indicator – measures the asymmetrical relationship between price and volume over the course of time and trends.
VW-MACD – Volume Weighted Moving Average Convergence Divergence
TTI – The Trend Thrust Indicator is an adaptive trend indicator taking both price and volume moments into its logic.
VPCI Indexes – The average VPCI score of each individual index component.
VPCI “V” Bottom – A capitulation signal occurring when the VPCI has fallen two standard deviations below a moving average of itself and then pops back above the lower standard deviation band (Bollinger Band).
For more information on Capital Weighted Volume/ VPCI Index:http://www.traderspress.com/detail.php?PKey=950&affiliate=volumeanalysis)
Disclaimer:
THE DATA AND INFORMATION ACCESSIBLE ON THIS PUBLICATION ARE PROVIDED “AS IS” AND THERE MAY BE DELAYS, OMISSIONS OR INACCURACIES IN SUCH INFORMATION AND DATA. VOLUME ANALYSIS LLC, CANNOT AND DOES NOT GUARANTEE THE ACCURACY, SEQUENCE, COMPLETENESS, TIMELINESS, MERCHANTABILITY OR FITNESS FOR A PARTICULAR PURPOSE OF THE INFORMATION OR DATA MADE AVAILABLE THROUGH THE SERVICE OR BY ANY FORCE MAJEURE OR ANY OTHER CAUSE BEYOND THEIR REASONABLE CONTROL. VOLUME ANALYSIS LLC SHALL NOT BE LIABLE TO YOU OR TO ANYONE ELSE FOR ANY LOSS OR INJURY CAUSED IN WHOLE OR IN PART BY ITS NEGLIGENCE, OMISSION IN PROCURING, COMPILING, INTERPRETING, EDITING, WRITING, REPORTING, TRANSMITTING OR DELIVERING ANY INFORMATION OR DATA THROUGH THIS SERVICE OR FOR INTERRUPTION IN ANY SUCH DATA. IN NO EVENT WILL VOLUME ANALYSIS LLC BE LIABLE TO YOU OR ANYONE ELSE FOR ANY DECISION MADE OR ACTION TAKEN BY YOU IN RELIANCE UPON SUCH INFORMATION OR DATA OR FOR ANY CONSEQUENTIAL, SPECIAL OR SIMILAR DAMAGES, INCLUDING BUT NOT LIMITED TO LOST PROFITS, TRADING LOSSES, DAMAGES RESULTING FROM INCONVENIENCE, OR LOSS OF USE OF THE SERVICE, EVEN IF ADVISED OF THE POSSIBILITY OF SUCH DAMAGES. THIS SERVICE MAY BE DISCONTINUED OR LIMITED AT ANY TIME.THIS INFORMATION IS FOR ENTERMAINTMENT PURPOSES ONLY.
Before trading or investing consider all relevant risk factors, including your own personal financial situation. Past performance is not indicative of future performance. Trading stocks forex, futures, or options involve risk and are not suitable for all investors. VolumeAnaylsis LLC, is not an Investment Advisor. Volume analysis produces and distributes impersonal newsletters for stock traders, option traders, and stock investors, via email and/or Internet. All information and services are for informational / entertainment purposes only. Individual trading advice is not given at any time.

