
It’s very tempting as a trader to try and game what you think a stock will do in the future by overlaying a macro thesis on it. This is something I call “script trading.”
Script trading can be very dangerous, but it can work, as long as you marry it with technical analysis and risk management. And there is a script that I am keeping my eye on for 2013.
A few months back Reuters reported something that I found fascinating.
Bond and money market assets at Boston-based Fidelity now total $848.9 billion, more than half of the company’s $1.6 trillion in managed assets. Ford O’Neil, a top bond manager at Fidelity, underscored the milestone on Wednesday during a media presentation in Boston.
The rise of bond and money market funds, including institutional assets, is a remarkable turn of events for Fidelity. The company built an empire in the 1980s and 1990s on stock funds and star stockpickers like Peter Lynch. Fidelity’s stock mutual funds held $761 billion at the end of June.
So for the first time in Fidelity’s history, equities are LESS than 50% of their holdings. To me this is a major contrary indicator and implies that there are a few trillion dollars (give or take a trillion) just sitting on the sidelines.
That money has to find return, and where will that return come from? Bank CD’s? Money market funds? Bonds? Real Estate? Justin Bieber collectibles? No, it’s going to come from the stock market.
I think that reports of the retail investor’s death have been greatly exaggerated. They’re not dead, but instead have just been driven into a zombie-like stupor from the carnage of 2008 and the Bernie Madoff’s of this world, and they are getting ready to “wake up” and get back in the game.
That is my script, and if it plays out the way I think then retail brokers will benefit. Let’s take a look at a couple of those brokers to see what their charts are saying.
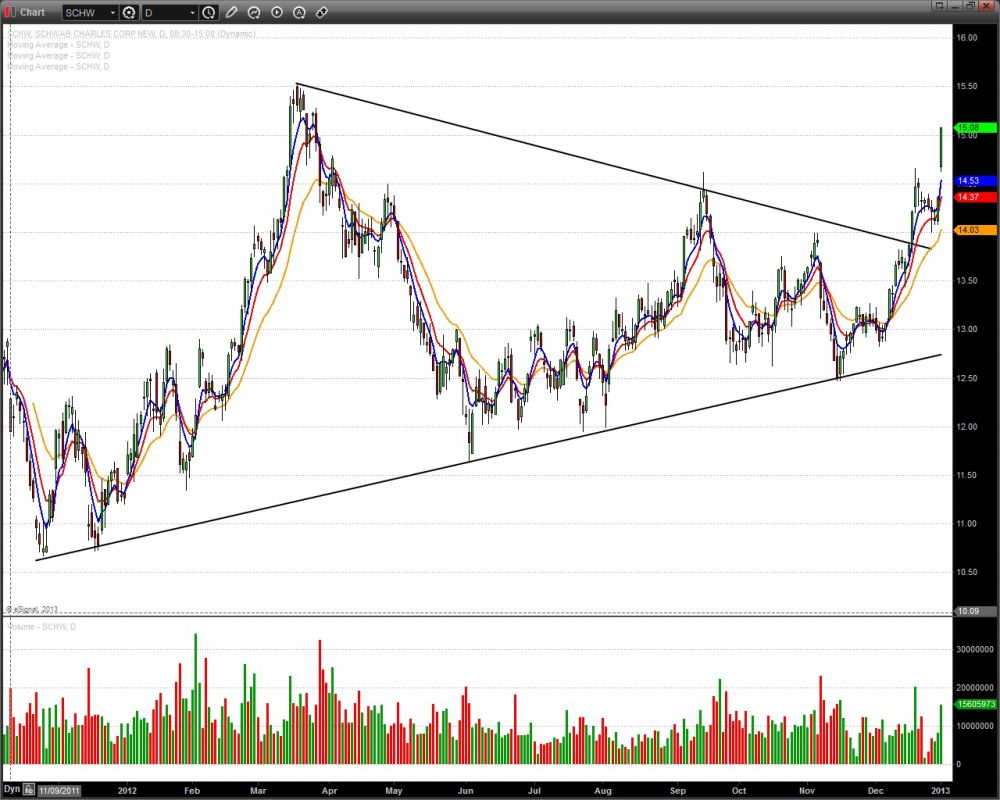
Charles Schwab (SCHW) has been making higher lows since late 2011, and in the process consolidating in a progressively tighter pattern which it recently broke out of. After the break out it flagged for a week and then broke out again on good volume.
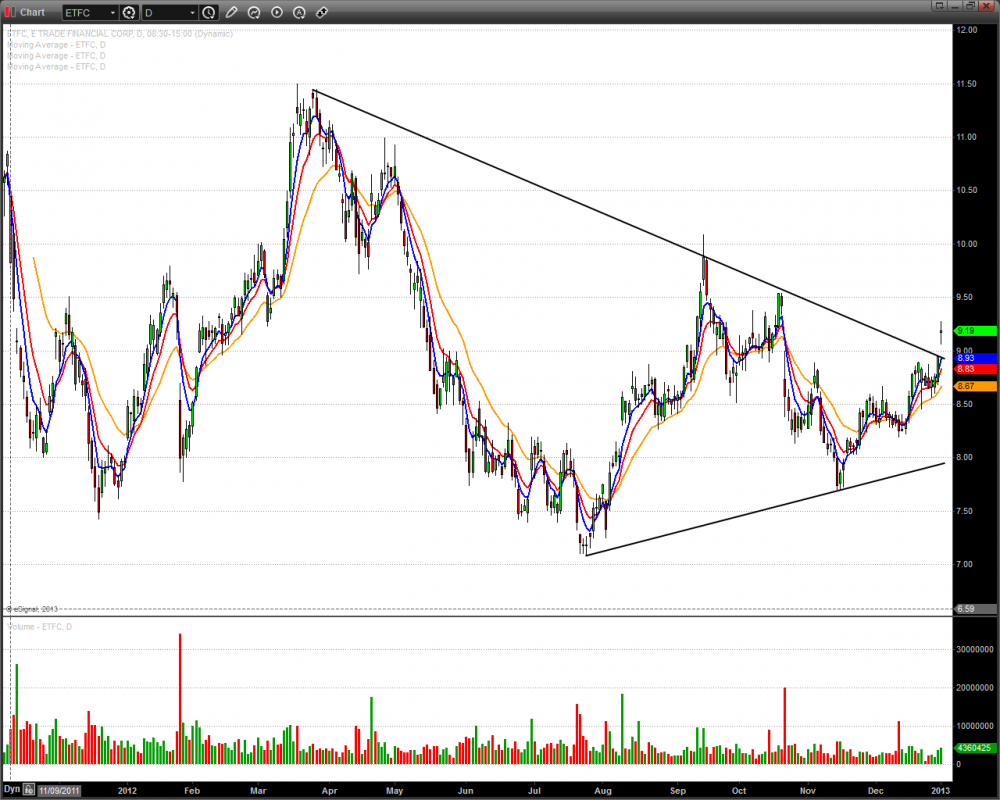
Although the chart of E*Trade (ETFC) is not as constructive as the SCHW chart, it did make a higher low since reaching its nadir in July, and has just broke out of a smaller consolidation pattern not unlike SCHW.
Those are the technicals and so far, they jive with my script. If the move I am looking for is beginning to happen it will be a longer term trend with multiple opportunities to take good chunks of profit out of it.
Keep an eye on the brokerage “script” for 2013, but always remember, price action trumps any script. Don’t give your risk management up, no matter how you think things will play out.

