

Last week I showed you how I use sentiment with the stock/bond ratio chart to determine how to look for market reversals. I personally like to combine the sentiment charts with other technical analysis to determine where we are within that cycle.
The use of short term sentiment readings, like the 15-60 and 120 minute charts will allow you to trade the squiggles. That is when the trend is going one way, but expectations of a counter trend rally should hit. The daily and weekly is used for the longer term trends, which usually last between 4-6 weeks.
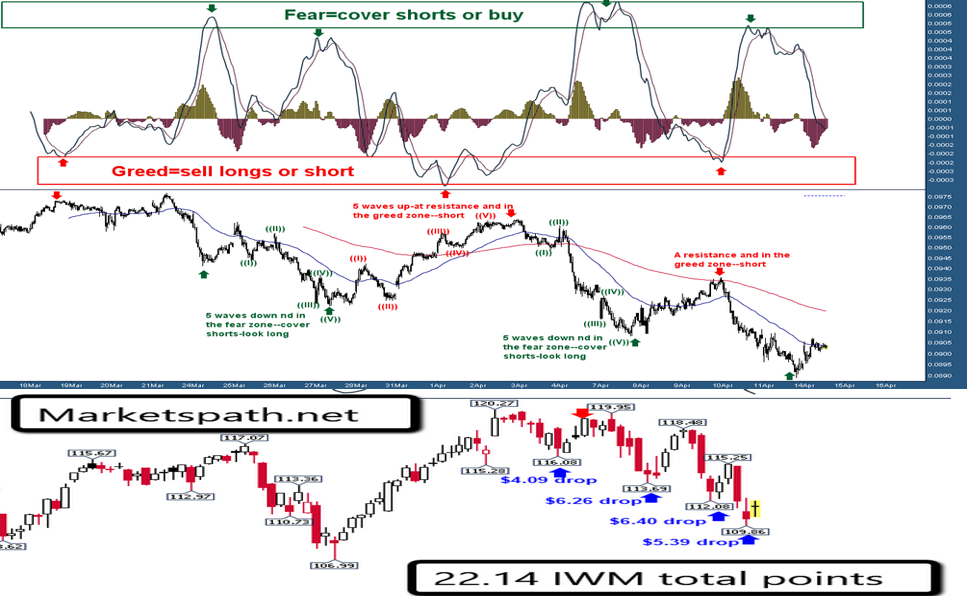
The Russell 2000’s ETF, IWM has dropped from a high of 120.26 and made a low at 109.96, which is a little over $10. We identified the topping formation and started looking short near the top. But instead of just holding the short from 120.26 to 109.96, we traded in and out of IWM four times, once we saw the short term sentiment was at bearish extremes.
When the stock market is dropping, volatility will increase. The good part about rising volatility, the stock market moves very fast in both direction. We obviously didn’t get the exact high and low for each cycle on IWM, but did come very close on a few of them. Instead of just making the max of $10 on the short side from high to low, we gave ourselves a chance to make $22.06 by covering shorts at bearish extremes-short term cycle turns and IWM was trading at support.
As long as you set the proper expectations that the market is going to do what it is going to do-and you will miss some moves, this strategy can work very well and be very profitable each week.

