
By: Pej Hamidi
Agilent Pharmaceuticals (A) has been on my “long-term bottom” list for a very very long time. Seriously, I thought this thing was ready 5 years ago, after completion of the right shoulder and a break of the neckline in early ’06. But then she failed and collapsed to close a gap from mid ’05. Fine. So then she tries again, valiantly over and over, the whole while bumping up against this overstretched neckline in late ’06 and early ’07. Prices oscillated above and below this neckline, as if they’re wrapping around it like a snake. This love affair lasts until mid-2008, when prices broke above the neckline for the last time, abruptly did a u-turn and commenced to cascade all the way back down, to test the 2002 low.
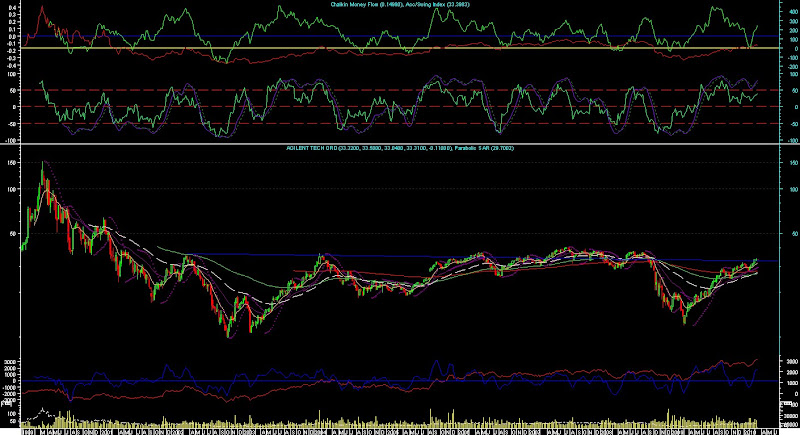
Edwards & McGee, in “Technical Analysis of Stock Trends”, tell us that H&S patterns can occasionally be “consolidations”. How would we apply that to this case? As prices oscillated from ’06 to ’08 around the neckline, there was a lot of distribution taking place. OR, we can interpret it as the slow and steady accumulating of the stock by a very large or several very large institutional funds, and when the banking crisis started, general market risk aversion routed Agilent like any other stock. The ’08 Banking Crisis and the ’09 Market Crash took everything down with it. Including Agilent. But alas, there is a silver lining to this story. The prior low was not taken out, like the majority of stocks around the world, and has once again, after a wonderfully bullish trend that started in March of 2009, crossed above that neckline. The question is, “Is the pattern valid anymore as an indication of a reversal?”. I would say the inverse H&S from back in 2002 to 2003 does not carry as much weight, if any, as it used do before the cascade sell-off. Also, the duration of the pattern is of concern as this dance with the so-called neckline has gone on far too long. What’s more important is the fact that the prior low was not breached, unlike most other stocks, and prices did not have a difficult time rallying back in a solid, unbroken trend, back to the mid $30’s, where the neckline would extend out to. But since most traders don’t look back more than a few months, if not weeks, it’s unlikely this pattern will be noticed at all. But I’ve noticed it and it’s back on my radar.
Profitable Trading To All.

