

My favorite technical indicator is definitely the Ichimoku Cloud. I use the Ichimoku cloud so much that it will likely be the topic of my next book. The Ichimoku Cloud, or simply “cloud,” is an indicator that is very easy to use. I like it because it takes very little, if any, knowledge of technical analysis to fully understand and use the cloud.
The simplicity of the cloud lets me incorporate it into all of my trading plans. The cloud plots key levels of support and resistance that can tell a trader if a stock is in bullish or bearish territory at a single glance. The indicator constructs a shaded area on the charts and if price is above this area it is considered bullish territory, and if price is below it is considered bearish territory. Obviously there is a lot more to it than that, but the finer points of the Ichimoku cloud are just as easy to understand.
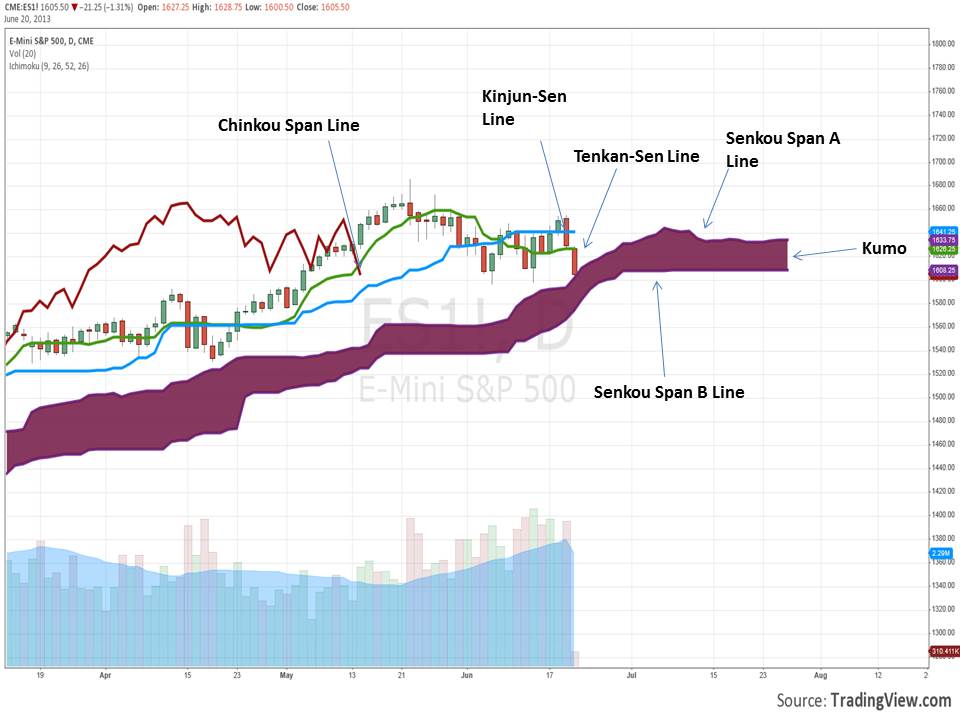
BULL/BEAR ZONES
The Kumo is the shaded area that we refer to as the cloud. In general we say that above this shaded area is bullish territory and below this area is bearish territory. The top and bottom of the cloud also serve as key breakout points.
SUPPORT AND RESISTANCE
The kinjun-sen line and the tenken-sen line are both key levels of support/resistance. The kinjun-sen line is also a level that traders often place trailing stops on when day trading. In my trading I use the cloud to time entries and exits. If I am long a stock then I will likely exit the position if the cloud is tested. I also use the cloud to avoid trades that are lower probability setups. This means that I never take a long when price is below the cloud, and I never short when price is above the cloud.
Using the cloud even in a limited capacity can help steer a trader into higher probability setups.
[Do you have any questions on using the cloud? Post a question for Keene below.]

