

It appears traders are expressing their bullishness on the market in an extreme way through the options market. While the bulk of sentiment data comes from polls taken from AAII, NAIM, and Investor Intelligence, we also can use the options market to get a feel of the sentiment within the market through the use of Put/Call Ratios.
Below is a chart that shows the S&P 500 (SPX) in the top panel with the Put/Call Ratio for index options in green, Put/Call Ratio for equities in red, and finally the Put/Call Ratio for all options in blue. When the line goes down we know that more calls are being purchased than puts for that set of securities. As you can see we’ve seen the Put/Call Ratio for index options drop to one of the lowest levels in the last year. The ratio for all options has also seeing heavier interest in calls relative to puts.
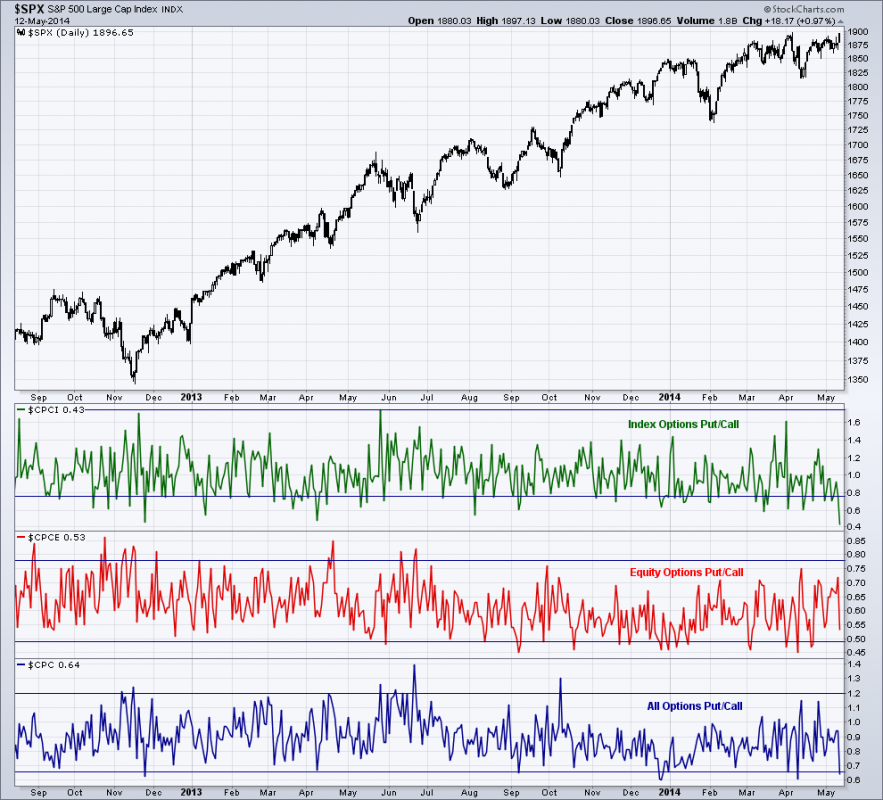
When we see all three areas of the options market drop we can begin seeing the optimism hit overly bullish levels. For example the index options, equity options, and all option Put/Call Ratios fell to very low levels in late-December of last year which eventually lead to a short drop in the S&P 500. Inversely, in June of last year we saw the Put/Call Ratios for all three of the segments spike up, marking the bottom after the short-term drop in stock prices.
As the equity market challenges new highs, it appears traders are growing overly optimistic as they shift their stance in the option pits away from the protection and defensive stance of puts, sending the Put/Call Ratios lower.
Disclaimer: The information contained in this article should not be construed as investment advice, research, or an offer to buy or sell securities. Everything written here is meant for educational and entertainment purposes only. I or my affiliates may hold positions in securities mentioned.

