
Trading September Tendencies
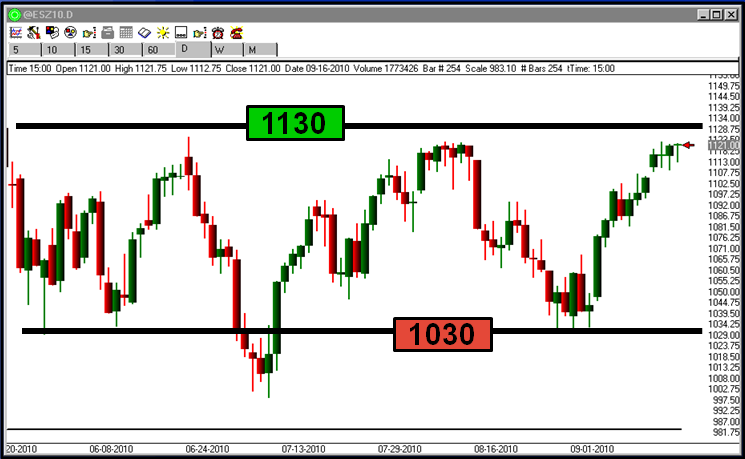
Summer trading has finally come to an end, and for most traders, this couldn’t come soon enough. For the last 3 months we have witnessed an erratic market, bouncing between the high and low of its summer range every 2-3 weeks. There has been no clear trend and no identifiable direction. A quick look at the Emini S&P futures from June 1st – Present gives us a clear view of this summer range.
With the exception of a four-day test below 1030, we have maintained a tight range between 1030 and 1130 since June 1, 2010.
That being said, let’s take a look at September. Historically, the monthly trend is bearish. In fact, September is the biggest losing month for the S&P, Dow, and NASDAQ. The month tends to be weak because of end-of-quarter mutual fund portfolio restructuring. School is back in session, vacation is over, and the quarter is coming to an end. Big money uses this opportunity to “clean house” and dump poorly performing assets on their books.
The only bullish sentiment surrounding September is the day after Labor Day which, prior to this year, was positive 12 of the last 15 years. But even with those odds in our favor, the S&P 500 lost 1.13% Tuesday on this historically bullish day.
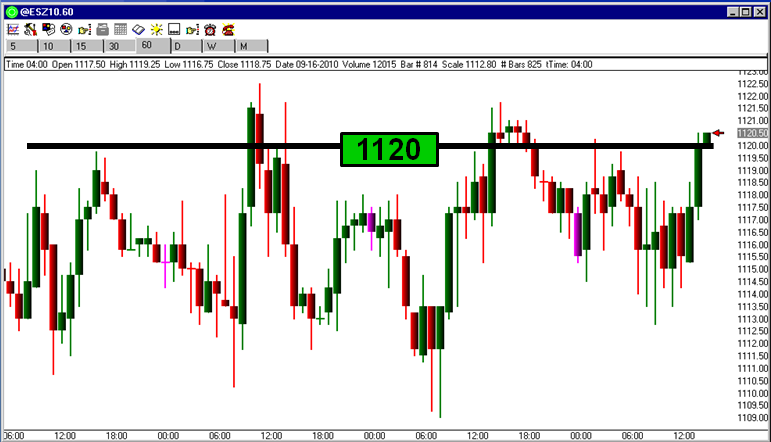
So what does this mean for September? Nothing says definitively that this market will go down over the next 3 weeks, but there are a lot of factors favoring the bears this month. Especially when you consider that on top of these negative tendencies, we are also approaching heavy resistance at the 1130 area on the S&P. On Monday, September 13th, the market again returned to the 1020 area. The emini S&P has surged to this level and failed on each of the following four days. We can see that in the 1-hour chart of the S&P futures below, illustrating Monday, September 13 – Thursday, September 16, 2010.
If you insist on going long, do so with caution. Any substantial pullback or bad news could confirm the market’s fears and trigger a selloff. To the downside, watch for strong support in the 1030 – 1040 range.
At this point the market has a decision to make. It cannot trade at these levels forever. It must choose a direction, and based on historical resistance levels, it is reasonable to expect a significant movement once this decision is reached. A clear move above the coveted 1130 support level will more than likely result in a powerful breakout to the upside. Whether or not we will reach the 2010 high of 1216.75 is unknown, but one would expect to at least return to pre-flash crash levels above 1160 on the emini S&P. In the event that the 1120-1130 level fails, once again, and this time for good, watch for a quick retracement. First stop – 1086, the low made on September 3rd and 8th that has held for the last 2 weeks in the ES. Below this level of support, it would not surprise most traders to see a move to the lows of this summer’s trading range at the 1030 – 1035 area.
From a longer term view, this is the third and hopefully final test of this 1130 resistance that has held the S&P hostage since the spring (see chart #1). On a shorter time frame, we are testing the highs for the fourth time in as many days. One thing is for sure, a big move is imminent. Remain liquid, wait for the big move, and ride it for some quick post-summer trading profits.
www.dtitrader.com 800.745.7444 Past performance not indicative of future results. Futures trading involves substantial financial risk. DISCLAIMER:There is a very high degree of risk involved in trading. Past results are not indicative of future returns. DTI Partners, Inc. and all individuals affiliated with this site assume no responsibilities for your trading and investment results. The indicators, strategies, columns, articles and all other features are for educational purposes only and should not be construed as investment advice. Information is obtained from sources believed to be reliable, but we do not warrant its completeness or accuracy, or warrant any results from the use of the information. This information is to be used only for your own research. You must assess the risk of any trade with your broker and make your own independent decisions regarding any securities mentioned herein. DTI Partners Inc. does not offer investment advice and is not an Investment Advisor. This information may have already been disseminated by DTI. Affiliates of DTI Partners, Inc. may have a position or effect transactions in the securities described herein (or options thereon) and/or otherwise employ trading strategies that may be consistent or inconsistent with the provided strategies.

