

The directional movement of a trend makes it progress through impulse waves. Let’s take a look at the patterns that interrupt the trend and are often referred to as countertrend patterns / price action.
KEEP IT SIMPLE: IMPULSE OR CORRECTION
Impulse waves by their very nature are pretty easy to identify, sharp, powerful affairs that cover ground fast, corrections on the other hand tend to be slow sloppy sideways patterns which can often be recognized by their overlap alone.
Keep it simple, if it’s not one it has to be the other.
Just by using these two simple observations it should not take long before you will be able to put price action into a more definable context. Try not to get too caught up in the correct labelling and concentrate more on being able to recognise an impulse wave to a corrective wave after a quick glance.
THREE RULES
The next step is to use the three rules that we listed in the previous article to confirm / negate your decision. Once you are happy you have located an impulse wave you then have a list of four possible corrective waves which comprise of three individual corrective patterns to choose from. These three patterns are called Zigzags, Flats and Triangles.
1. Zigzags (5-3-5; includes three variations: single, double, triple)
2. Flats (3-3-5; includes three variations: regular, expanded, running)
3. Triangles (3-3-3-3-3; four types: ascending, descending, contracting, expanding)
Three of the possible corrective waves can be made up of either of these patterns alone and the fourth can comprise of a doubling and rarely a trebling of them. These are referred to as Combined Structures. More about them later, first let’s take a look at Zigzags and Flats.
ZIGZAGS (5-3-5)
A single zigzag in a bull market is a simple three-wave declining pattern labeled A-B-C and subdividing 5-3-5. A five-wave impulse wave followed by a three wave correction followed by another five wave impulse wave. The top of wave B is noticeably lower than the start of wave A, as illustrated in Figures 1 and 2 often referred to as a shallow retracement.
Occasionally zigzags will occur twice, or at most, three times in succession, particularly when the first zigzag falls short of a normal retracement target. In these cases, each zigzag is separated by an intervening “three” (labeled X), producing what is called a double zigzag (see Figure 3) or triple zigzag. The zigzags are labeled W and Y (and Z, if a triple).
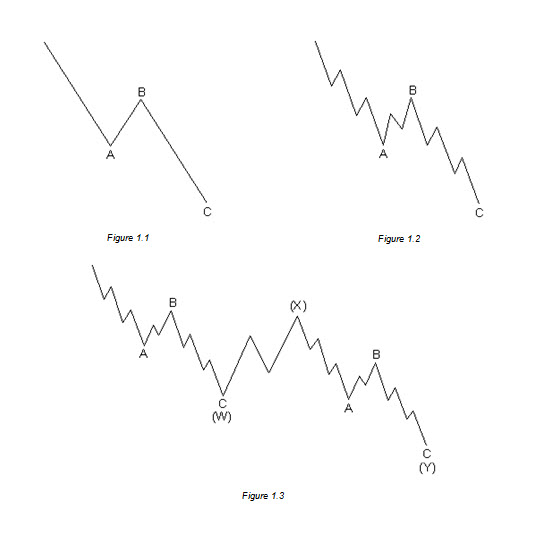
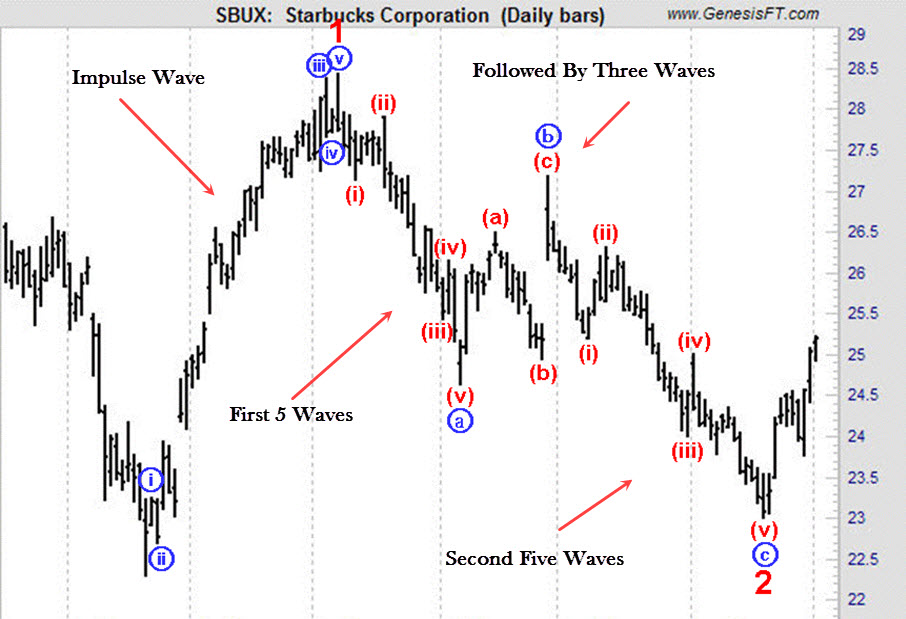
Figure 2 is a second wave zigzag taken form Starbucks Corporation. Notice the clean impulsive wave on the left labelled wave 1 red that was then corrected by a 5-3-5 Zigzag labelled wave 2 red. Zigzags are a common corrective wave for the second wave of an impulse.
FLATS (3-3-5)
A flat correction differs from a zigzag in that the subwave sequence is 3-3-5, as shown in Figures 2.1 – 2.4. Since the first actionary wave, wave A, lacks sufficient downward force to unfold into a full five waves as it does in a zigzag, the B wave reaction seems to inherit this lack of countertrend pressure and, not surprisingly, terminates near the start of wave A. Wave C, in turn, generally terminates just slightly beyond the end of wave A rather than significantly beyond as in zigzags.
Flat corrections usually retrace less of preceding impulse waves than zigzags do, again referred to as a shallow retracement. They participate in periods involving a strong larger trend and thus virtually always precede or follow extensions (3rd waves). The more powerful the underlying trend, the briefer the flat tends to be. Within impulses, fourth waves frequently sport flats, while second waves rarely do.
Three types of 3-3-5 corrections have been identified by differences in their overall shape. In a regular flat correction, wave B terminates about at the level of the beginning of wave A, and wave C terminates a slight bit past the end of wave A, as we have shown in Figures 2.1 and 2.2. Far more common, however, is the variety called an expanded flat, which contains a price extreme beyond that of the preceding impulse wave. In expanded flats, wave B of the 3-3-5 pattern terminates beyond the starting level of wave A, and wave C ends more substantially beyond the ending level of wave A, as shown below.
In a rare variation on the 3-3-5 pattern, which we call a running flat, wave B terminates well beyond the beginning of wave A as in an expanded flat, but wave C fails to travel its full distance, falling short of the level at which wave A ended. There are hardly any examples of this type of correction in the price record.
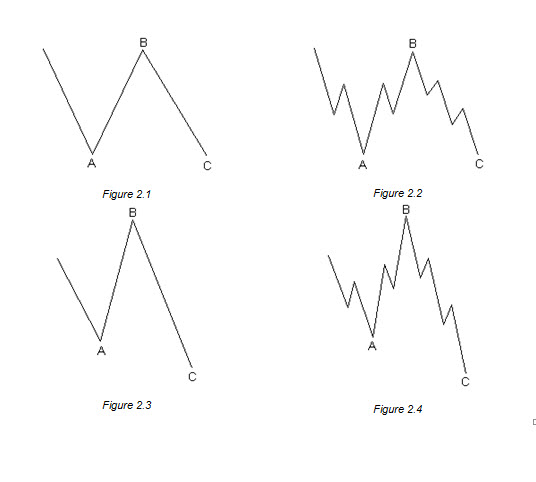
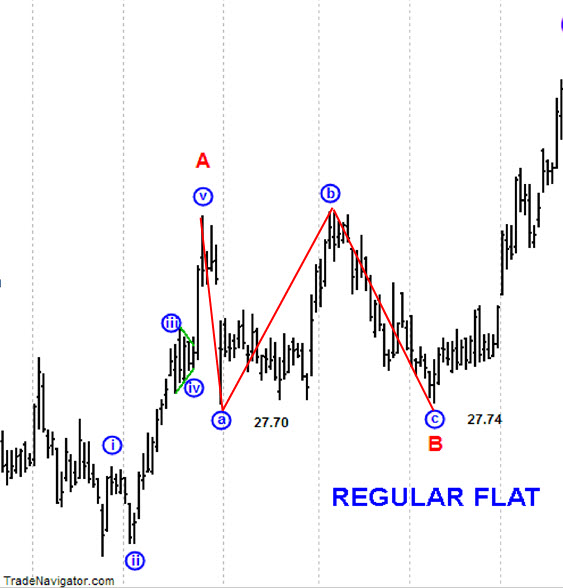
Figure 4 is an example of a Regular Flat as a “B” wave of a possible ABC Zigzag. I advise students to get into the practice of connecting the swing points of price action with a simple trendline, like I have done here with the red lines; this will help train your eye to see these patterns at a glance. Don’t worry about the correct high or low just do it and familiarize yourself with the “Shapes of the Market.”
#####

