
US TREASURY FUTURES REPORT 04/02/2009
- 8:30 AM US NONFARM PAYROLL (-650 K), UNEMPLOYMENT RATE (8.5%), AVG HOUR EARNINGS (0.2%), AVERAGE WORKWEEK (33.3)
- 10:00 AM ISM NON-MANU INDEX (42.0)
ECONOMIC DATA 04/02/09 MONSTER EMPLOYMENT INDEX (118 VS 122), US WEEKLY CLAIMS (669 K), US FACTORY ORDERS (1.8 VS 1.5) EIA INVENTORY #-NAT GAS (0 BCF)
TREASURIES DROP AS SIGNS OF G20 COOPERATION, AGREEMENT ON MARK TO MARKET ACCOUNTING, OFFERS RALLY TO EQUITIES, SUPPLY CONCERNS FOR GOVERNMENT DEBT.
US Treasuries fell for the first time in four sessions, after leaders at the G20 Summit reached accords on a number of policies designed to reignite the global economy and offer a sense of stability through regulation of financial institutions deemed at least partially responsible for over speculating the world into its worse financial crisis in several generations. The G20 countries pledged to commit over a Trillion dollars (Trillion has become the new shock word that makes markets pay attention these days) through the IMF (International Monetary Fund). While this commitment allowed the world to stand up and cheer for the end of the crisis, it clearly also states that the levels of sovereign debt being floated in the marketplace will not be abating anytime soon.
In addition, lower yielding fixed income was pressured by the announcement by the FASB (Financial Accounting Standards Board) has come to an voted agreement to modified the concept of mark to market accounting-the accounting standard which has been blamed for the creation of so called “toxic assets” The amendments allow for aspects of mark to market to be set aside in cases of “reasonable judgment and cause.” Treasuries also came under pressure due to squaring up of positions ahead of Friday’s release of February nonfarm payrolls and unemployment figures for the United States. A less than expected cut in interest rates by the ECB also helped to create a less than ideal environment for further gains in government debt.
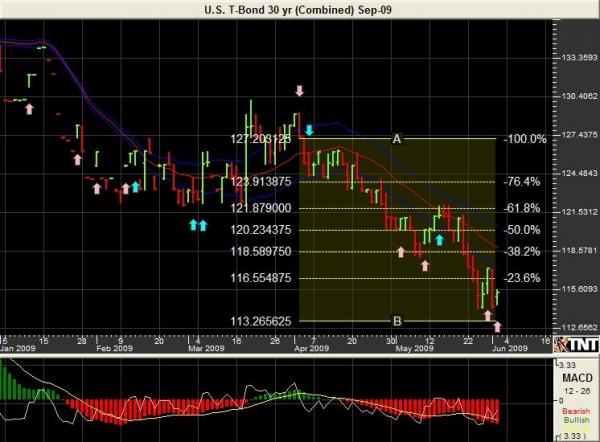
Technically, June 30 year futures pulled back and through the initial technical support called for in yesterday’s report of 129.100. At this level, the market is not giving any clear signs through technical indicators of its next direction. The market does have room to test its next level of support at 128.120If this level does not hold, look for a test back to 127.060. Still looking at the long term support of 125.120 as a key level for the channel that has formed so far in 2009. Volatility in the next few session should find significant resistance at 130.250.
|
US DEBT FUTURES |
OPEN |
HIGH |
LOW |
CLOSE |
CHANGE |
|
US M9 (US 30 YRS) |
130.165 |
130.305 |
128.255 |
129.050 |
-1 135/32nds |
|
TY M9 (US 10 YRS) |
124.070 |
124.180 |
123.050 |
123.120 |
-29/32nds |
Prepared by Rich Roscelli & Paul Brittain.
Past performance is not indicative of future results. The information and data in this report were obtained from sources considered reliable. Their accuracy or completeness is not guaranteed and the giving of the same is not to be deemed as an offer or solicitation on our part with respect to the sale or purchase of any securities or commodities. Alaron Trading Corp. its officers and directors may in the normal course of business have positions, which may or may not agree with the opinions expressed in this report. Any decision to purchase or sell as a result of the opinions expressed in this report will be the full responsibility of the person authorizing such transaction.

