

Last week’s solid gains in gold provided pretty compelling technical indications that the long-term secular bull market is re-exerting itself. This comes at a time of year when the yellow metal tends to benefit from strong cyclical influences.
HISTORY SHOWS ROOM TO RUN
In fact, as my colleague Jonathan Kosares reminded our clients back in early-July, “The average gains coming after the end of July, when compiled over the last 10 years of the gold market, have been 11.3%. The total average annual gains through this period have been 16.6%. Put another way, on average, 2/3 of all gains for the year have come after the summer months.”
Even at Monday’s high of $1,676.79, gold was up less than 4% since the end of July, suggesting there’s room to run.
TRIANGLES ARE CONTINUATION PATTERNS
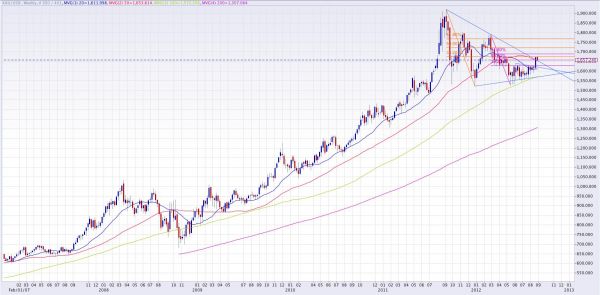
From the summer solstice until Tuesday of last week, the gold market was confined to range less than $82. This narrow consolidation band formed a smaller symmetrical triangle within the broader symmetrical triangle seen on the weekly chart in Figure 1 below.
This chart pattern has proven to be very reliable over the years, and in conjunction with the anticipated cyclical pressures, prompted me to write a special report entitled Gold Technicals Portend Impending Breakout on August 9, in which I stated, “Prudent investors would be well advised to take advantage of the remaining days of quiet consolidation.”
UPSIDE BREAKOUT
Since that report was written, the upper-bounds of both triangles have been exceeded. The market accelerated away from the 20/50/100-day moving average complex, which had converged within the confines of the smaller of the two triangles as well.
The important 200-day moving average was exceeded on a close-basis, as was the 50-week moving average. More than 50% of the decline from $1,790.64 (29-Feb high) to $1,526.80 (16-May low) has been retraced, and gold has tested above the 38.2% retracement level of the entire decline from the record high at $1,920.74 (06-Sep-11) to the $1,522.48 corrective low (29-Dec-11).
PATTERN TARGET
The measuring objective off the smaller triangle projects to $1,709.03, and would bring the yellow metal within striking distance of the halfway-back point of the entire corrective move once again. An average post-July gain of 11.3% would project to $1,795.35, which closely corresponds with the $1790.64 peak (29-Feb). And the measuring objective off the larger triangle projects to a new all-time high beyond the $2,000 psychological barrier.
Click here for additional gold analysis by Grant.

