Background: Relative Strength Index (RSI) is one of several innovative technical indicators introduced by J. Welles Wilder Jr. in his 1978 book, New Concepts in Technical Trading Systems. It was developed as another means of comparing the strength of price changes, putting up and down days based on the close into two separate categories. In that regard, it has some similarities to the Directional Movement Index.
There are really two different uses for the term “relative strength.” The first suggests the strength of one market vs. another or how a market or market sector compares to some benchmark. The second usage refers to the strength of a price move for one period against the strength of a move for another period and in this usage serves as a measure of momentum.
Purpose: One of the problems in analyzing prices is that they sometimes make sharp, erratic moves that can distort the overall picture of strength or weakness for a market, especially when one of the older erratic moves drops out of the calculation. Wilder’s RSI provides a smoothing effect for these changes and places the current strength of a market within a 0 to 100 scale.
Relative Strength takes the average of the up closes for a given time period and divides that up average by the average of down closes during that period. Typically, 14 periods are used for RSI, but the number can be more or less, depending on the sensitivity of the index desired. That can vary to fit the time frame the user is trading.
By plotting RSI on an index scale of 0 to 100, a move to above 70 can suggest an overbought situation that might lead to a downturn or a move to below 30 can suggest an oversold condition that might lead to an upturn in prices. (Those thresholds can change to 80 in bullish markets or 20 in bearish markets.)
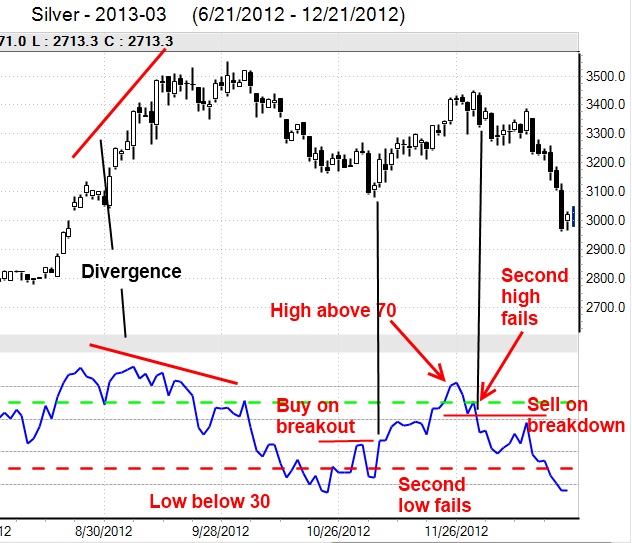
Basic signals: As with a number of other indicators, RSI is most effective when its readings are at the upper or lower extremes of the scale. When the RSI moves above 70 and then fails to move above a previous peak and falls through the downside of a previous dip, prices can be expected to move lower. On the other end of the spectrum, a bottom failure occurs when RSI drops below 30, then fails to set a new low and moves above a previous peak.
Several examples can be found on the chart below. The first is a buying situation on a bottom failure when the second low is not as low as the first low and RSI breaks out higher. The second is a signal for a selling opportunity when RSI tops 70, the second RSI high is below the first high and RSI drops below the RSI low. Of course, not every move above 70 or below 30 results in a great signal so any trading requires sound money management techniques.
As with other indicators, divergence between the direction of prices and the RSI line is also an important clue that RSI has detected an underlying change in market conditions and prices may be about to turn in the direction of the indicator, as the chart illustrates. These clues can be used in conjunction with traditional chart pattern or moving average analysis.
Pros/cons: RSI is one of the most popular indicators, but not every signal requires instant response. Traders should keep in mind that the first foray of RSI into overbought or oversold territory may be just a warning or an alert, with the second move into this area serving as the real point at which to take some type of trading action.
RSI is adaptable to various time frames for those who want to adjust the sensitivity of the indicator. It has also been the basis for other indicators building on the RSI concept.