 With markets roaring back and the SPY having broken $110 for the first time in over a year just moments ago, it seems that Relative Strength Rotation methods have come back into vogue.
There are literally dozens of ways to define relative strength, and it is important to recognize that different computations will serially and stably outperform their peers during various behavioral epochs. Furthermore, inflection points can be harsh using this method. Various smoothing methods, use of multiple time frame references, and standard money management techniques can be a big help with that. All in all, it’s a hard strategy to beat over time for those interested in always being invested.
Below I present two basic mechanical trading systems employing rankings of current price divided by simple moving averages among selected ETFs. The specific relative strength readings are provided every night in ETF Rewind.
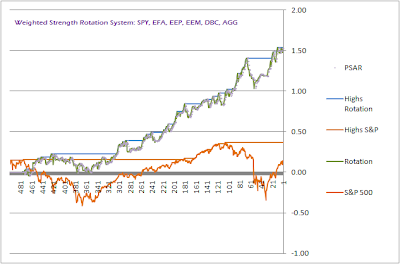
1. Asset Class Rotation
The chart below indicates the equity curve that would have resulted from rotating into the single top performing major asset class ETF among the SPY, EFA, EEP, EEM, DBC and AGG, as ranked according to the highest relative strength measure, then re-balancing weekly on a simple/ non-compounded basis, with no friction/ trading costs assessed.
The compound average annual growth rate for the nine-year study period would have been +10.7% with a simple Sharpe Ratio of +0.5 and a maximum peak-to-valley draw down of -19.4% (versus the S&P500’s -51.8%). The equity curve is not optimized in any way, and involves no use of leverage or shorting: this is merely an extremely simple macro-asset-class switching method.
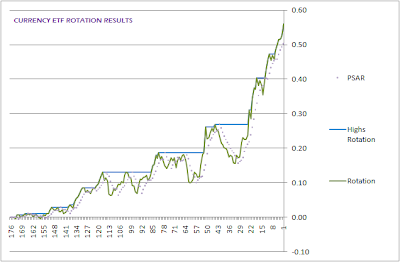
2. Currency Rotation
As currencies have been highlighted in the news lately, attached is a graphic highlighting another simple strategy rotating into the two top performing Currency ETFs among UUP, FXA, BZF, FXE and FXY, re-balancing weekly on a reinvested/compounded basis, with no friction/ trading costs assessed.
The compound average annual growth rate for the three-year study period would have been +14.2% with a simple Sharpe Ratio of 2.4 and a maximum peak to valley draw down of -8.9%.


