U.S. non-farm payrolls shocked traders Friday morning with a much lower-than-expected reading. Non-farm payrolls only rose to a seasonally adjusted 88,000, from 268,000 in the preceding month whose figure was revised up from 236,000.
That compares to pre-report expectations for a 200,000 jobs number. The dissappointing figure is the lowest seen since June 2012. The jobless rate did decline to 7.6% from last month’s 7.7%
WEEKLY CHART
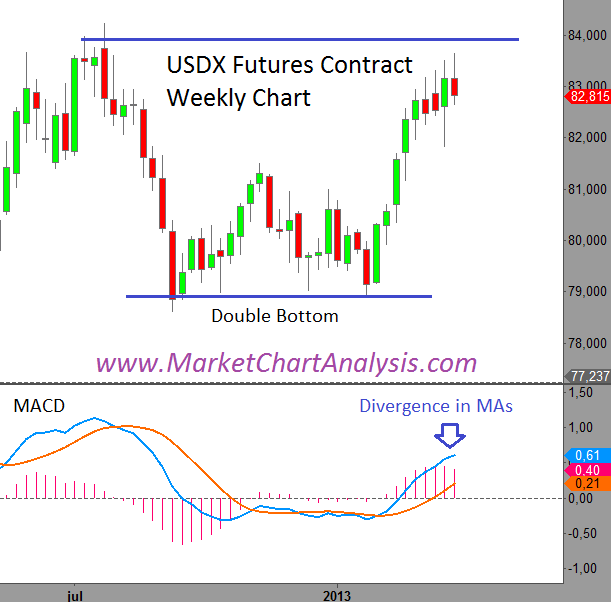
The dollar index, which tracks the performance of the greenback versus a basket of six other major currencies, shows a double bottom at 78.930 points. This level is a strong support for the USDX.
A good rally came after this second bottom taking the dollar to a 2013 high of 83.660. In order to continue the upswing, the price must break above the 83.750 level (July 2012). In the meantime, MACD large divergences on moving averages are tipping us of a possible reversal of the current uptrend.
Yesterday’s candle was a pronounced “gravestone doji.” When this happens after a prolonged advance it is very bearish.

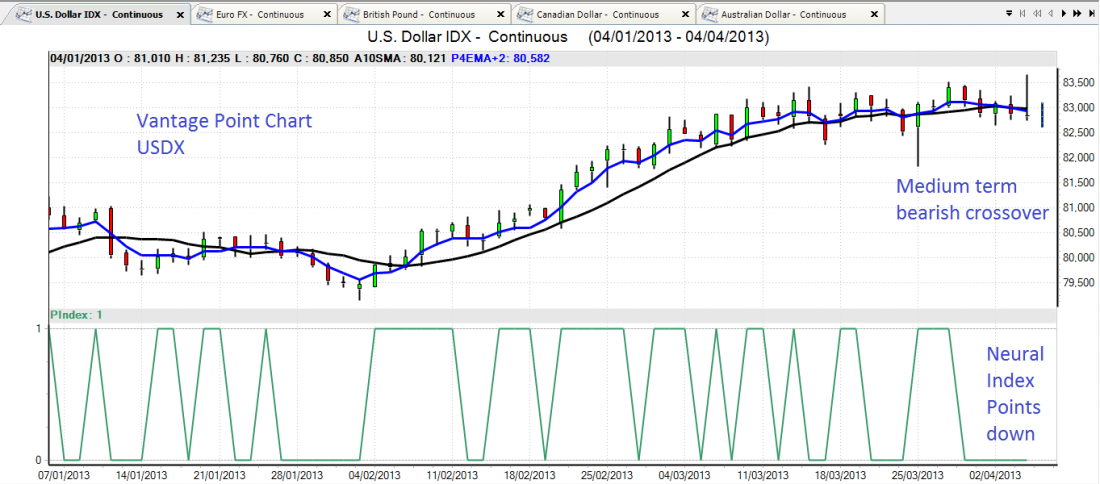
On the Vantage Point chart, we can also see the first signs of weakness as the “predicted medium term crossover” is currently edging below the 10 day simple moving average. This is a bear sign for the dollar. The “predicted neural index” also points out that the market is expected to move lower over the next few days.

BOTTOM LINE
The lower than expected reading on the jobs report will most probably be taken as negative for the overbought U.S. dollar. This would have an initial positive impact on gold as it will again highlight its role as a safe haven. It will also have a negative impact on the stock market, since it’s a possible sign that the U.S. economy is potentially losing traction.
Click here to see how previous jobs reports have affected the U.S. dollar index and the Dow Jones Industrial Average.


