

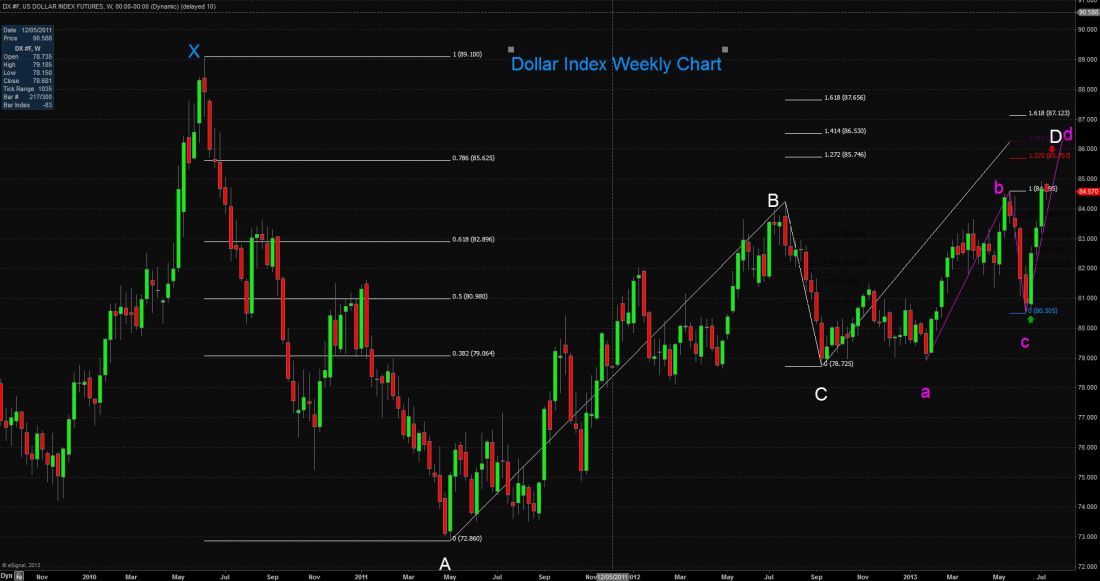
The U.S. dollar index weekly chart shows a bullish breakout since the June 19th Federal Reserve meeting. Since then, we have seen price action breakout key Fibonacci levels from both the B to C leg (highlighted in white) and the other b to c (highlighted in purple).
KEY TEST
Currently price is facing critical resistance at the 85.00 level. If price can accelerate beyond this barrier, further momentum may target the 85.62 region. It is around that area that we have a plethora of key Fibonacci levels and multiple reversal ABCD patterns that may help trigger a corrective move.
RATE DIFFERENTIALS FAVOR DOLLAR
Dollar momentum may continue as the ECB may look to perform one more rate cut this year and it appears that Mark Carney, the new chief of the BOE will maintain the central bank’s current accommodative stance.

