
My home is far removed from Wall Street and the nation’s financial centers, but the value of the U.S. dollar is important to me – in fact, to all U.S. citizens. It’s not just the dollar itself but the effect that its value has on all the other markets that interest me.
The U.S. dollar is a key “outside market” that many other markets are tracking very closely. The U.S. stock market and crude oil are the other important outside markets. Together, these three markets are at the heart of today’s intermarket analysis as markets react to each other’s price moves. Respected trader, analyst and analytical software developer Louis Mendelsohn has been studying how markets react to each other for decades, and his VantagePoint Intermarket Analysis Software uses intermarket analysis to produce a number of predictive indicators.
Call now and you will be provided with FREE recent forecasts
that are up to 80% accurate. 800-732-5407
If you would rather have the recent forecasts sent to you, please go here
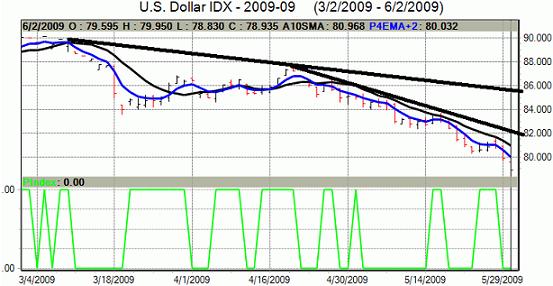
When I look at a VantagePoint chart of September U.S. Dollar Index futures, I see a market that appears to be trapped in a three-month downtrend on the daily bar chart and this week hit a fresh eight-month low. Bears have the solid near-term technical advantage, and there are no early technical clues to suggest a market bottom is close at hand.
To turn the U.S. Dollar Index around and get the upper hand, the bulls’ initial objective will be closing prices above solid technical resistance at last week’s high of 81.60. To keep the downtrend rolling, the next downside price objective for the bears is to produce a close below solid technical support at 77.50.
VantagePoint, a valuable trading tool from which a trader can glean clues on potential near-term price trend changes or continuation of present trends, suggests there will be more downside pressure in the near term. It’s not as simple as saying that if the dollar is down, other markets will be up or vice versa, but near-term clues provided by VantagePoint can and do give a trader a key edge.
VantagePoint’s predicted medium-term crossover study shows clearly that the predicted 4-day exponential moving average of typical prices (blue line) is below the actual 10-day simple moving average close (black line). Where I am from, that is a near-term bearish clue, and the fact that both lines are trending lower adds to the bearish near-term indication.
I also keep a close eye on VantagePoint’s Predicted Neural Index, which is presently reading 0.00, also suggesting downside price pressure in the near term. This is a proprietary indicator that has proven to be quite reliable when used in conjunction with other VantagePoint indicators.
Simply, when the predicted simple three-day moving average value of typical prices is greater than today’s actual three-day moving average value, the Predicted Neural Index is 1.00, indicating that the market is expected to move higher over the next two days. When the predicted simple three-day moving average value of typical prices is less than today’s actual three-day moving average value, the Predicted Neural Index is 0.00, indicating the market is expected to move lower over the next two days.
When I look at the current U.S. Dollar Index chart, it is showing me a weakening market situation. A weaker dollar tells me that here is at least one factor that would provide some upside price pressure for crude oil, metals, grains and other commodities.

