

By: Zev Spiro
A broad based sell-off took place yesterday in all the major market indices erasing up to two weeks worth of gains. Is the uptrend over? To determine the health of the current uptrend I will examine the characteristics that define the bullish trend in the SPDR S&P 500 (SPY). In addition, a potential distribution topping pattern in The Goldman Sachs Group, Inc. (GS) may be a few steps ahead of the markets. A trigger and follow through of the GS pattern, and names in similar stages, can provide a roadmap to the future direction of the overall markets.
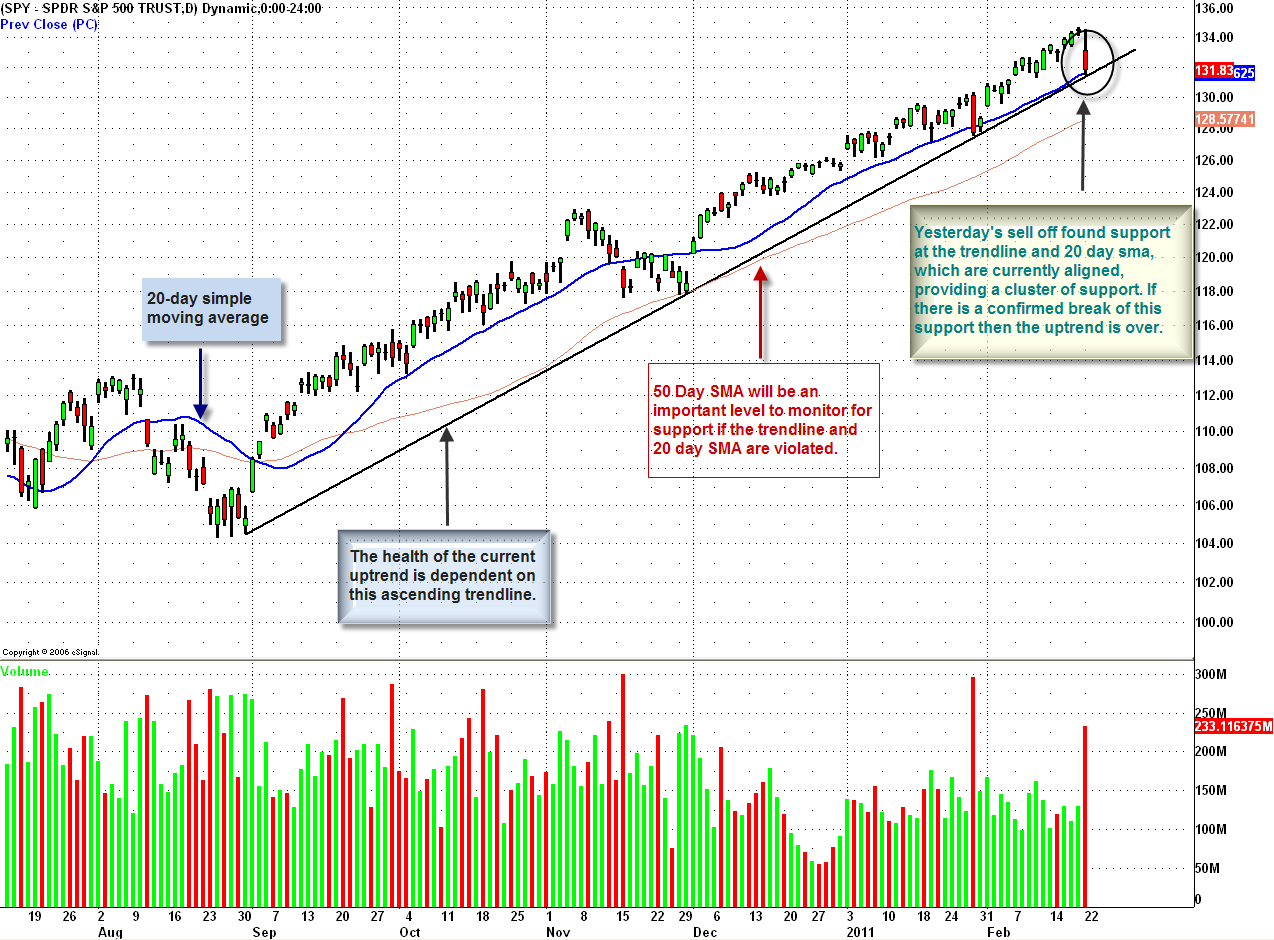
In September 2010, an intermediate uptrend began in the SPY. The defining characteristic of the bullish trend, in my opinion, is an ascending trend line (log scale) that began from the lows of August 31, 2010 with a second touch point on November 30, 2010. The line continued to extend higher and tested for a third time on January 28, 2011, holding. Currently, the 20-day simple moving average is aligned with the intermediate trend line adding validity to this support area. Yesterday’s price action traded down to this level and held. If there is a confirmed break of this support level, provided by the trend line and moving average, the uptrend is over.
Be aware that there are three trends: up, down and most commonly forgotten sideways. If the current uptrend is broken, the markets are not necessarily in a downtrend. Before the commencement of a downtrend, above minor degree, distribution will present itself in the charts indicating a top.
Chart 1: illustrates the intermediate ascending trend line in SPY, currently aligned with the 20 day sma, that defines the current uptrend.
Yesterday’s sell off resulted in technical damage in many individual names. I am seeing many potential distribution topping patterns preparing for further downside. Recently, I highlighted topping patterns in Con-Way, Inc. (CNW), Freeport-McMoRan Copper & Gold Inc. (FCX) and Southern Copper Corp. (SCCO), all have triggered as shorts and began their descent. Many individual names, such as GS, are in distribution mode with bearish setups, while several other names are only beginning to form distribution patterns. Results of bearish pattern triggers will play a crucial role in determining the markets outlook.
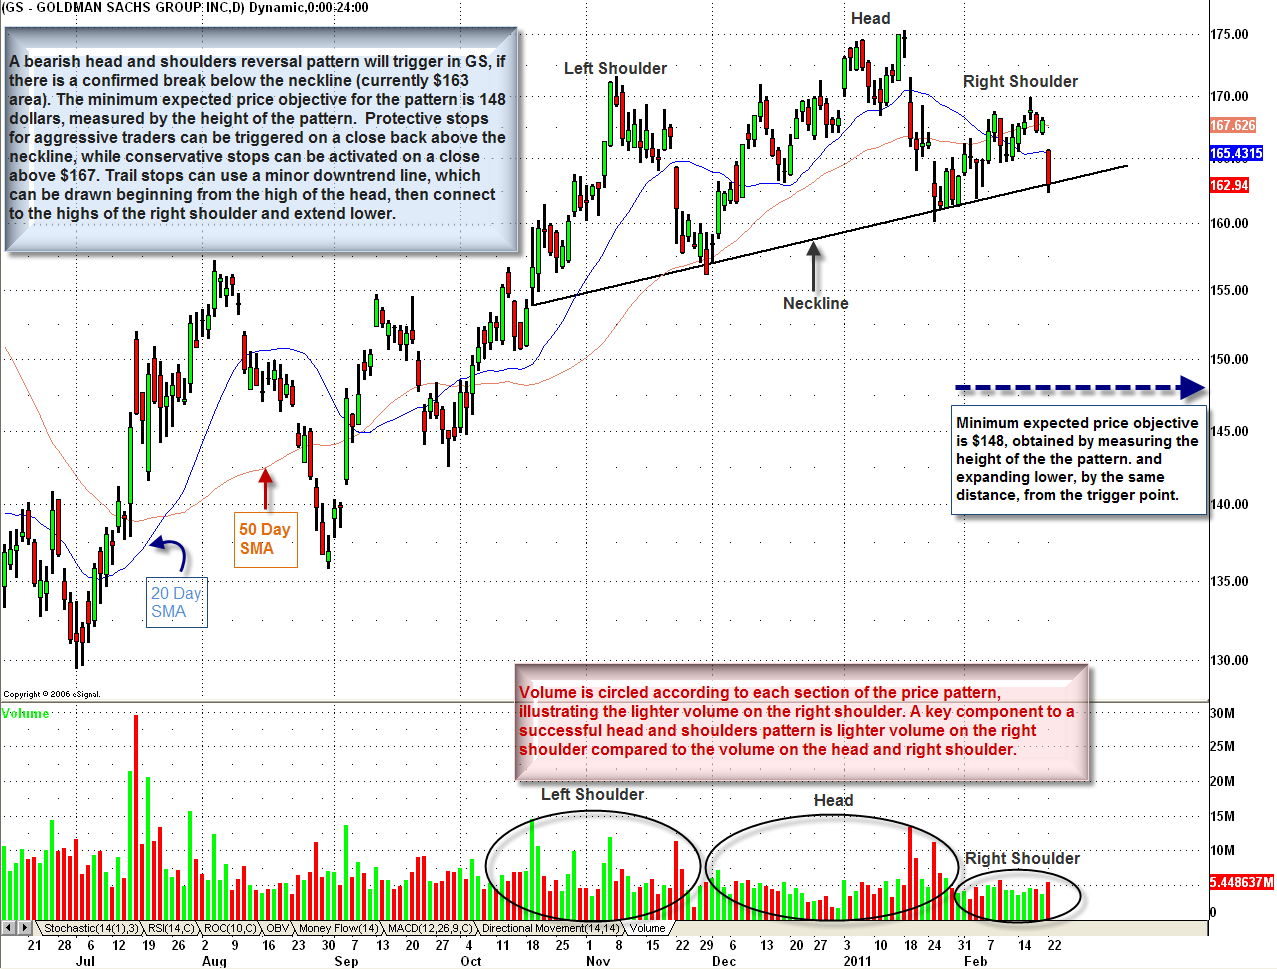
Chart 2: Depicts a potential bearish head and shoulders pattern in GS, which will trigger with a confirmed break of the neckline (currently $163 area). Target: $148 is the minimum expected price objective. Protective Stops: aggressive: trigger on a close back above the neckline, conservative: activate on a close above $167. Trail Stops: confirmed move above a minor trend line, which can be drawn connecting the highs of the head to the highs of the right shoulder.
If you are interested in receiving Zev Spiro’s market letter, please email zevspiro@oripsllc.com subject “T3”
*DISCLOSURE: Short GS, SPY, CNW, FCX, SCCO.
This material is being provided to you for educational purposes only. No information presented constitutes a recommendation by T3 LIVE or its affiliates to buy, sell or hold any security, financial product or instrument discussed therein or to engage in any specific investment strategy. The content neither is, nor should be construed as, an offer, or a solicitation of an offer, to buy, sell, or hold any securities. You are fully responsible for any investment decisions you make. Such decisions should be based solely on your evaluation of your financial circumstances, investment objectives, risk tolerance and liquidity needs. Visit the T3Live Homepage, Virtual Trading Floor, and Learn More About Us.

