
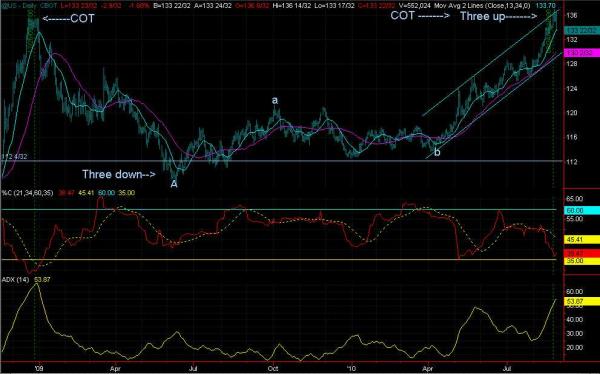
US Treasury 30 year bonds: The daily chart is making a parallel between the top – change of trend – seen in December 2008 and the current market condition. In December ’08 price highs where being reached when both key trend-ability indices called the trend “extended” From that high prices unfolded in a countertrend decline which bottomed in June of ’09 at 109.00. The advance from the 2009 low is also countertrend, leading to the current double top at 136.00. Besides the long term chart setting up for a double top at 136.00, %C and ADX are both calling the uptrend “extended” just like December 2008. While prices may be in for some crazy swings in this topping area, the longer term trend calls for a decline back to 109.00. Unlike the decline in the first half of 2009, traders should look for something different: instead of two down legs, look for three as in an Elliott “C” wave part of a flat correction.
On a near term basis, counter or anti trend style trading systems may be the better way to trade until the new down trend has momentum.
I welcome your comments and questions:
http://www.traderassist.com/optinmarketmap.htm
Jack F. Cahn, CMT

