
The gap hunt-and-fill process is something markets become obsessed with during corrective phases. As noted last week, although the S&P futures closed a significant gap last Thursday, which represented a timely act of technical housekeeping, the Nasdaq futures have a nagging unfilled gap between 4428-4444 that beckons.
At this time, the non-committal chop fest reflects this one key technical difference between the S&P and the Nasdaq.
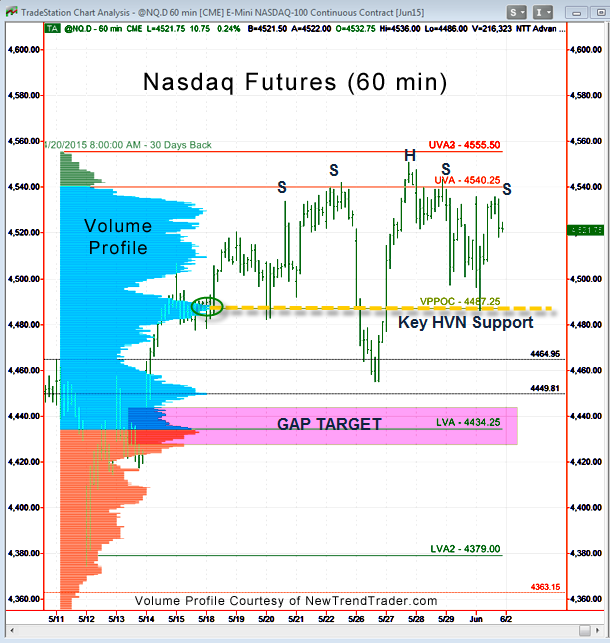
On Monday, the NQ began the day by testing support at the High Volume Node at 4486. For those wanting to trade long, that was an attractive place to look for an entry because High Volume Nodes are generally respected.
While my upside target for the Nasdaq futures is 4617-4627, if you squint you can see a bearish Head and Shoulders pattern in the 60 min NQ chart to the left (I’ve labeled the peaks). On the one hand, the presence of this pattern increases the chances of a surprise gap-fill run. On the other hand, there’s nothing more bullish than a failed bearish pattern that everyone sees.
A Note on Volume Profile
The histogram on the left side of the chart shows the volume distribution in the Nasdaq futures for different periods of time. Key support and resistance levels are indicated by the peaks and troughs. If you would like to receive a primer on using Volume Profile, please click here

