There goes July. Did anybody notice? June started high and ended low. July started low and ended high. Except for the color of the candles on the chart, there wasn’t much to chose between them … and not much to remember them by.
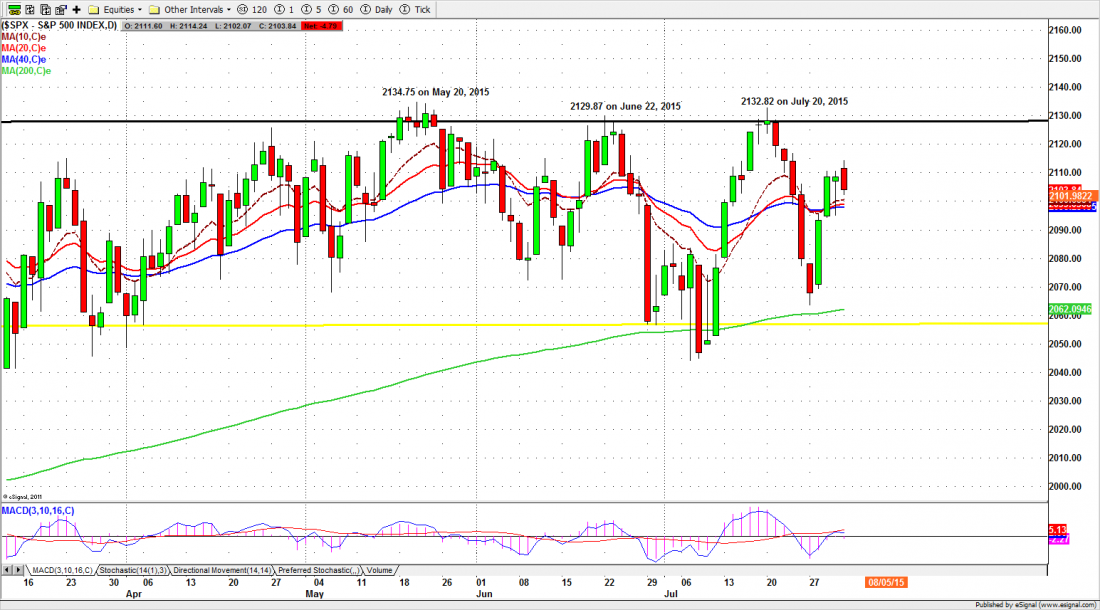
The US equity market, at least as represented by the Standard and Poor 500 (SPX), has now spent the first seven months of the year drifting along near the top of a long bull market, unable to go up and unwilling (or not permitted) to go down. July was absolutely typical: it made a high at 2132, made a low at 2044, and closed a little above the mid-point between the two, at 2103.84. Perfect.
But this still feels like the summer of our discontent. The big caps in the S&P reported about a 4% decline in sales year-over-year, while earnings are near record highs. Very suspicious: you can “massage” earnings – and they do, they do — but sales are tougher. The money either comes in or it doesn’t . The advance-decline line is making new lows and lower highs, and the “Fear Index,” the VIX, is at record lows. But so what? Nobody’s scared.
And why should they be? The market has bounced off the 200-day moving average every time it needed to, the month closed with a 2.1% advance over June, and we’re sitting above a long-term uptrend line that stretches back to 2013 and beyond. It’s summer. Everybody’s at the beach. What could possibly go wrong?
This week
The SPX has been contained within a trading range between roughly 2135 and 2040 pretty much since March. When it approaches the top, it falters; when it approaches the bottom it bounces. Obviously this can’t last forever, but as long as the index doesn’t break below the long-term uptrend line around 2077, or the 200-day moving average around 2062, or the yearly live pivot around 2055, we don’t see it going down.
In fact we still have an upside target for the SPX around 2200. We think that is reachable this year.
S&P500 mini futures
The S&P500 mini futures (ES) closed at 2098.50 Friday, about five points below the previous close. It ran up in the pre-market, but fell sharply in the day session and was only saved from closing at the low by heavy end-of-month trading. But it remained above its momentum lines, the 10-,20-, and 40-day moving averages. Those lines will be the key areas for today’s trading.
A move below 2086.50 will suggest a further decline to 2078, or lower to 2065. That would give Monday’s trapped shorts a chance to get out, if any are still alive. Holding above 2092 will encourage buyers to take a run at Friday’s high, 2108. The short-term indicators are neutral, but all the very short time-frames are becoming overbought. It might bounce, but the bounce may not last.
Major support levels for Monday: 2065-62, 2054-55, 2043.50-45.50, 2038-35;
major resistance levels: 2126.75-28.50, 2134-36.50
For more detailed market analysis from Naturus.com, free of charge, follow this link
Chart: S&P500 cash index ($SPX) July 31, 2015