Tuesday was a day filled with missed deadlines: Greece defaulted on a payment to the International Monetary Fund; the deadline for a nuclear deal with Iran passed without comment; and Russian and the Ukraine failed to reach agreement on sales of Russia gas, so the Ukraine may have to look elsewhere for heat this winter.
Against that background the S&P 500 mini-futures made an inconclusive consolidation move Tuesday; bounce up at the open, steady decline to just below Monday’s low, and a slight recovery into the close. It finished with a four-point gain for the day. But for the month of June it is down 51.50 points, almost all of that since the Greek debt crisis blew up.
Sell in May and go away is a cliché. But sometime clichés work.
Today
There are a raft of economic reports out today and Thursday and some of them will move the US market. There is also a rumor Greece may cancel the referendum set for this weekend in exchange for a better deal from the EU. We’re not giving it much credence, but traders will be looking for any excuse to rally, and an unfounded rumor is enough for that purpose.
Regardless of what happens today, we don’t think many traders will want to go into the July 4 holiday weekend with open positions, so there will be a flurry Thursday morning.
So far the market still hasn’t confirmed that the long-awaited intermediate term correction has started and Tuesday’s indecisive trading didn’t clarify much.
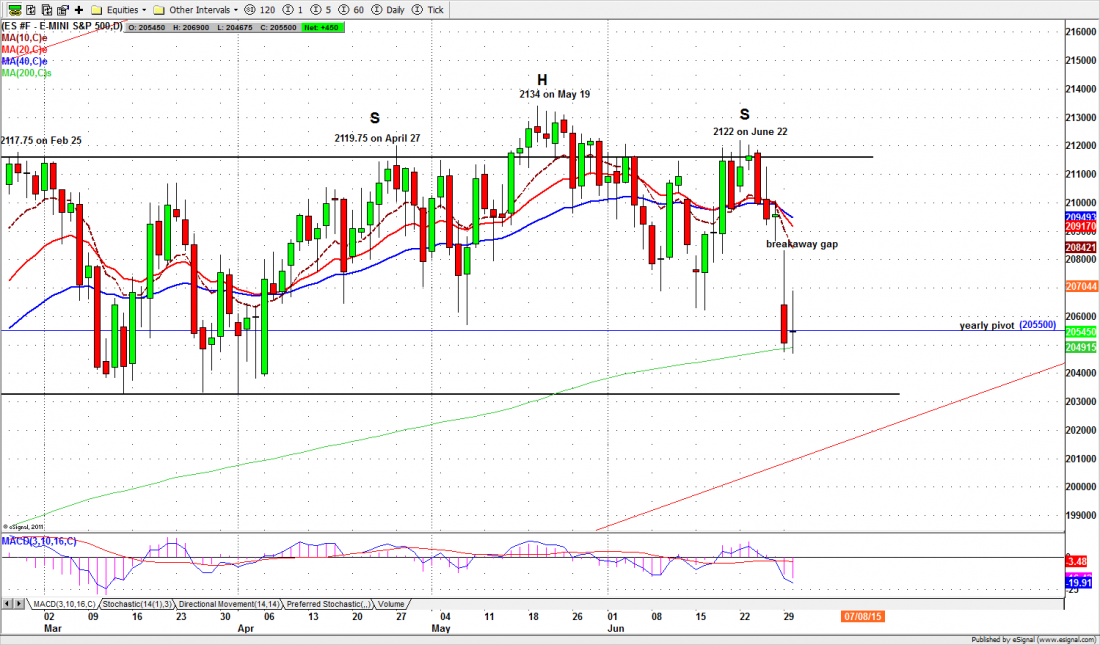
The 200-day moving average line (currently around 2047) will continue to be an important support line. A break below it will not only confirm that the yearly pivot is broken, it will also confirm that the monthly range low is broken, and could trigger selling momentum. The targets would be the unfilled gap at 2030 and 2018.50. The final monthly range breakdown target is in the 1980 area.
Holding above the 200-day moving average line could lead the ES to repeat yesterday’s range, with a bounce up to retest yesterday’s high around 2066.50 or higher up to 2083-85. However the ES shouldn’t fill the 2095.50 gap. And as long as this gap remains unfilled, the short-term trend is down.
Major support levels for Wednesday: 2043-30, 2018-21, 2006-03, 1980-75;
resistance levels: 2085-86, 2093.75-95.50, 2105-06, 2112.50-14.50,