

In my last market update (7/20) I characterized the 300+ point rally in the NQ as “unsustainable.” My initial target was 4492 and we hit 4497 on 7/28. This downside forecast was not due to any particular bearishness on my part. By nature, I’m actually more bullish than bearish, and in my own trading I prefer to trade from the long side.
Nevertheless, the Volume Profile chart showed very weak volume on those final 100 points. Moreover, a bigger picture megaphone pattern had completed and the series of five up-gaps was indicative of a blow-off move of the type seen in late 1999 and early 2000.
Were you trading back then? They were heady times. We had multiple bubbles across various tech niches: chips, biotech, networking, software, cell phones, etc. Sound familiar?
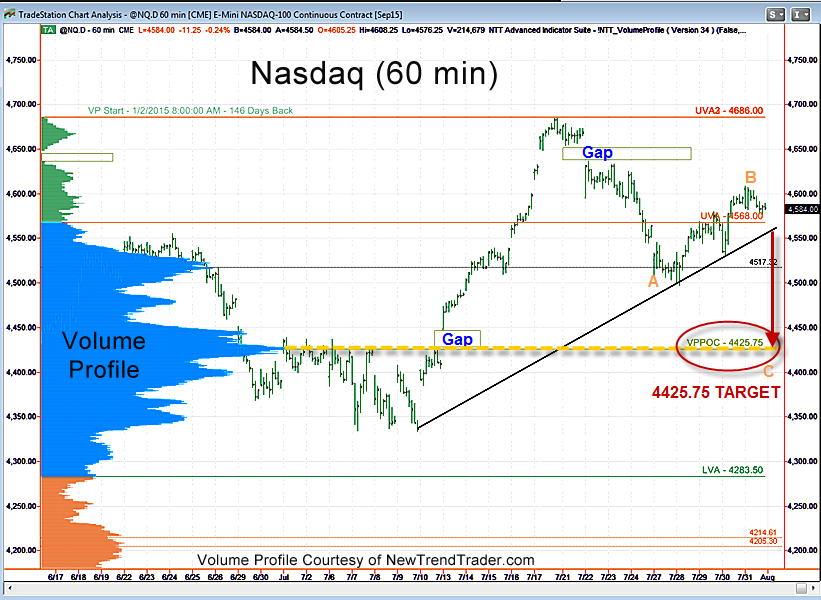
I’m not calling for a major “top” here; I think we probably go higher as we wait for $700 gold, but I do expect a normal ABC pullback at the very least that ends up at the Volume Profile Point of Control (4425) and fills the gap there.
There is a great deal of support for the Nasdaq 100 at 4425 and for me that is an interesting place to consider longs. I don’t expect the market to fill the 7/10 ‘breakaway gap’ on this correction.
A Note on Volume Profile
The histogram on the left side of the chart shows the volume distribution in the Nasdaq futures for different periods of time. Key support and resistance levels are indicated by the peaks and troughs. If you would like to receive a primer on using Volume Profile, please click here

