ALARON US TREASURY FUTURES REPORT 04/09/2009
ECONOMIC DATA 04/10/2009: all times EST
GOOD FRIDAY HOLIDAY- US, EUROPEAN MAJOR MARKETS CLOSED
04/09/09-04/09/09 US INTERNATIONAL TRADE ($-26 B VS -$36 B), US JOBLESS CLAIMS (654K VS 664 K), EIA INVENTORY # (20 BCF) US 10 YEAR NOTE AUCTION (BID TO COVER 2.49, YIELD 2.95%.
US TREASURIES FALL NEAR KEY SUPPORT LEVELS AS GLOBAL EQUITY RALLY LEAVES LOW YIELDING, SECURE DEBT IN THE DUST.
Treasuries fell in a shortened session on Thursday as the Global equity rally bolstered by new stimulus programs and a brightened corporate earnings outlook eroded demand for secure, comparatively low yielding financial instruments. A relatively well received US 10 year note auction failed to offer much support to Treasury Prices. The record auction of $28 Billion garnered a more than respectable bid to cover ratio of 2.49. However the yield went off at a higher than expected 2.95 % (coupon rate for this issue was 2.75%). The patterned mirrored the results of Wednesday’s 3 year note auction and suggests that while buyers remain interested, they will not be clamoring to purchase at any one auction. Interested parties are well aware that plenty of supply will be offered in the market for the foreseeable future. The apparent movement toward equilibrium between government support and continued record supply should keep Treasuries in a range that will eventually break to test the downside of the market, as technical recovery from the 2008 and inevitable inflation pressures will likely offer a significant challenge to the US Government’s ability to stem the tide of falling debt prices.
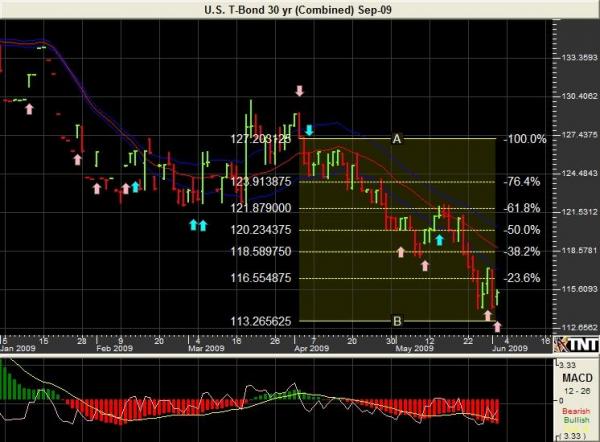
Technically, June 30 year Treasury futures came within 8 points of testing the key support level of 125.120. A break of this 125.120 level should see the market move to 124.280. Through that level, the market should make a test of 122.200. Strong resistance has set up at 128.050.
|
US DEBT FUTURES |
OPEN |
HIGH |
LOW |
CLOSE |
CHANGE |
|
US M9 (US 30 YRS) |
127.135 |
127.135 |
125.200 |
125.295 |
-1.215/32nds |
|
TY M9 (US 10 YRS) |
122.210 |
122.240 |
121.295 |
122.105 |
-135/32nds |

Prepared by Rich Roscelli & Paul Brittain.
Past performance is not indicative of future results. The information and data in this report were obtained from sources considered reliable. Their accuracy or completeness is not guaranteed and the giving of the same is not to be deemed as an offer or solicitation on our part with respect to the sale or purchase of any securities or commodities. Alaron Trading Corp. its officers and directors may in the normal course of business have positions, which may or may not agree with the opinions expressed in this report. Any decision to purchase or sell as a result of the opinions expressed in this report will be the full responsibility of the person authorizing such transaction.


