

The US Federal Reserve, in its July meeting left the door open for interest rate hikes at its next meeting in September. The statement however cautioned the markets that ‘some’ improvement was needed in the US labour markets for the Central Bank to hike rates. This has significantly shifted the market focus to the two jobs reports, one of which is due this week for July (to be released on August 7th)and the other in early September. The US unemployment rate currently stands at 5.3%, albeit recent economic data on the employment cost index showing the slowest pace of growth at 0.2%, leaving a lot of questions to be answered.
It is this uncertainty that is likely to bring a lot of volatility to the markets for the next two months. In the USDCHF technical analysis presented below, we combine traditional methods of technical analysis on the Renko price charts to derive possible trade levels, which is a better way to trade rather than predicting the price action.
USDCHF (50 Pips Renko Chart): Against the Swiss Franc, the US Dollar broke out from its sideways pattern after managing to clear the resistance at 0.95. This level marks a well recognized
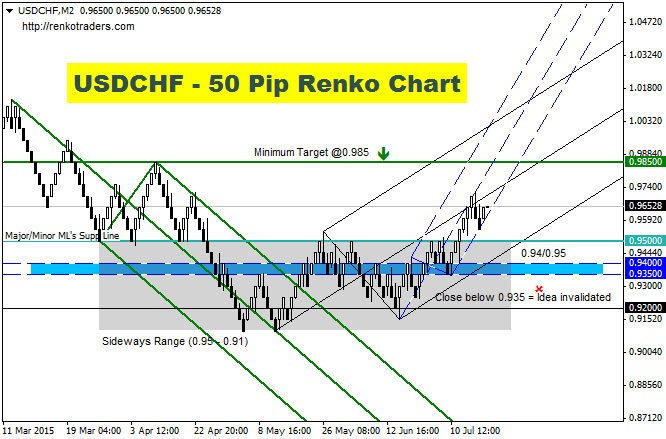
When applying the median lines to the chart, we see that the break out off the major median line (Green) indicates a move to the upside. This view was confirmed by the next major median line (Black). Here, we notice that price has been rejected near the median line in the first attempt and we could expect some kind of consolidation taking place here.
Plotting a minor median line (Dashed Blue) we can anticipate a possible correction to the downside if prices fail to cut across the minor and major median lines. But there is equally a risk of decline to 0.95 through 0.94 as well, which marks the lower support.
With 0.95 – 0.94 being the immediate price level of recognition, we can therefore assume a possible test down to this level ahead of the rally to 0.985. But we need to take a closer look into the price action, which is where we make use of a 25 Pip Renko chart, as outlined below.
USDCHF (25 Pips Renko Chart): When looking at the 25 Pip Renko chart, the most noticeable pattern is the potential head and shoulders pattern that is playing out currently. The H&S pattern is not yet complete; as we need to see the right shoulder to be completed with a break of the neckline at 0.955 (thus the right shoulder is outlined and not shaded).
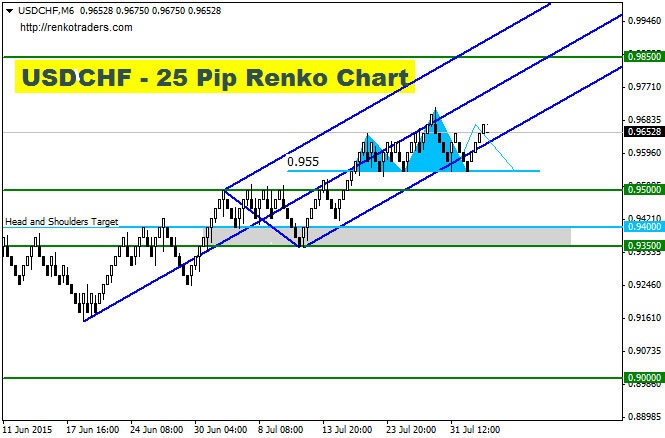
If this pattern plays out, USDCHF will see a measured move target down to 0.94. When taking into consideration the support/resistance levels based off the median line tool, just below 0.94 comes the lower support at 0.935.
Combining the analysis from the 50 and 25 Pip renko chart, we can now form our USDCHF trade levels.
- Watch the 25 Pip Renko chart for the Head and Shoulders pattern to be completed with a break of the neckline at 0.955.
- If the H&S pattern is valid on the 25 Pip chart, then we can expect a gradual decline to 0.94 which completes the measured move
- However, in the event the head and shoulders pattern is invalidated, then the short bias trade will be ignored and we instead wait for USDCHF to correct to 0.95 – 0.94 which will mark the start of a renewed rally to 0.985
- The rally to 0.985 will however be at risk should price close below 0.935

