

When trying to find the best indicator, or best system, we sometimes tend to complicate our strategies a bit too much. Let us not forget one of Mr. Warren Buffet’s most effective and successful rules: “Keep it simple, stupid!” (K.I.S.S.)
BEST INDICATORS
After studying practically all the indicators that are available on most of the charting platforms, I’ve come to realize that the two best and most useful when trading are the following:
1.) Volume: it’s raw, it’s plain, and it does not lag the market.
2.) Moving averages: if well applied, they can forecast market action
Today I would like to focus on the second one. Senior analyst of TraderPlanet Darrel Jobman explained this trend indicator very well in his tutorial: Trend Indicator: Moving Averages.
The system I’ve found to be extremely useful is the following:
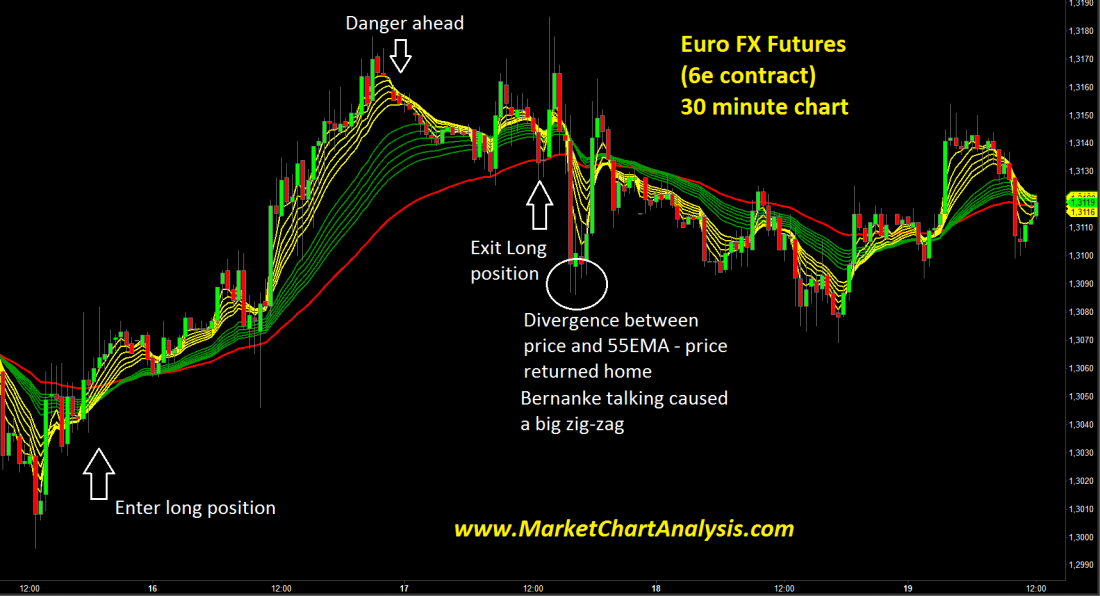
The yellow EMAs are 3, 5, 7, 9, 11 and 13 sessions, whereas the green ones are 21, 24, 27, 30, 33 and 36, and finally the red EMA is 55 sessions.
INTERPRET THE CHART
The yellow lines are the fast ones, and what I’m looking for here is not a cross between them but for a cross above or below the green lines (slower MAs). This gives me immediate direction of the market.
The red EMA is used many times as support or resistance. We can see how the price tends to pullback towards the 55 and bounce again. This happens every time there is a large divergence between the price and the red moving average. It tends to go back home. If the move is big, it might cross the 55EMA and turn the trend or it just might test the red line and head back in the same direction it was in. Either way, this will give me entry levels.
A word of caution: at times we’ll see the candle slice through all moving averages. This usually happens straight after a big announcement (FOMC, Jobs report, etc.). I always tend to stay away from the market for the first hour after any big announcement since the chances of getting whipsawed are very high.
TIME FRAMES
This system works on all the time frames, and is most efficient when using 5, 15, 30 and 60 minute charts.
I leave you with one of my strong working tools. It’s not perfect. It’s not the best system, but it works pretty well for me, since it follows market action very closely and gives me not only direction but also entry levels – what more do we need?
Disclaimer:
This is my personal opinion and not a recommendation or an offer to buy or sell securities, or any financial instrument. As trading and investing in any financial market may involve serious risk of loss, I strongly recommend you do your own due diligence.

