
As Iwrite this article on time frames, I wish to speak a little bit about my experience as a trader. Throughout the years, I have made my fair share of mistakes. Those of you that trade/invest in the markets know it is just part of the game. It is a trial and error type career, like kids, we must touch the hot stove/oven, even when our parents told us not to. Once touched, we pray we learn our lesson and never do it again. I was no different as Ibegan to learn how to trade. I would try something, find out what works, what does not. As I began to utilize the technicals of price, pattern and time Ibegan to throw away the other technical indicators that were always talked about. For instance, stochastics, MACD, RSI and more. These I tried to use in my first years as a trader but my winning percentage was never more than 60%. Of course due to my discipline at the time, the losers would often outweigh the winners by 2-3x and we all know that math will not work. Over time, I learned to make sure I cut my losses, and as I learned a new breed of technicals, Ibegan to let my winners max out on profits. One of the biggest things I learned was to trust price, pattern and time. Today I wish to speak a little bit about time and how important it can be in one respect.
As part of one of the fastest growing financial guidance and education firms out there, one of the biggest lessons we wish to express, is to use the Larger Time Frame Method. This method is exactly how my partners and Iat InTheMoneyStocks.com were able to pinpoint within a week or two the top on the market recently. The SPY(a good gauge of the S&P 500) was trading for 2-3 weeks between $94-$96. During this time, President Obama, Treasury Secretary Geithner and the Federal Reserve Chairman Ben Bernanke all stated multiple times that green shoots were sprouting. The media was singing their praises, mutual funds and hedge funds were dumping hundreds of billions back into the market and a V-shaped bottom seemed to be in place. At heart we are contrarian thinkers and use psychology as part of our analysis techniques. Seeing this pumping in the media put us on high alert. We started looking at the daily SPYchart. Sure, it looked over bought but let’s face it, a chart of anything can remain that way for days, weeks, months or even years. After analyzing the daily and seeing mixed signals and signs, we decided to do something most investors or traders lack the common sense to do. Iwent to the next bigger time frame. This is where we made an amazing discovery.
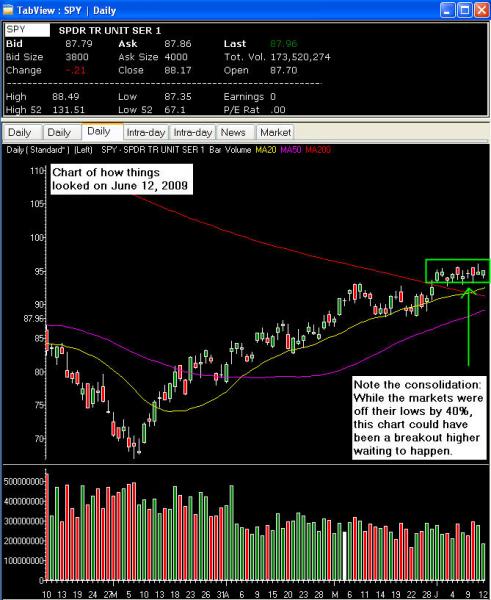
This is one of the secrets which may seem like common sense but for some reason so few people are willing to do it. Whenever you find it hard to read a chart but feel something is overbought or oversold on a certain chart or when people seem far too bullish or bearish, always go to the next bigger time frame. If you are right on the move coming, it should be showing and confirm on that time frame. The chart below shows a great example of the confusion that was in the markets. The daily chart shows the markets off the March lows by 40%. However, at the same time a great bullish consolidation pattern is forming which many beginner/amateur traders were thinking meant the markets were going to go higher.
What did we do? We first got worried based off the psychological indicators. With the President, Federal Reserve and Treasury all pumping the markets, the media blasted it to everyone. That was what worried us. Too many bullish people. With that we looked at the daily chart below.
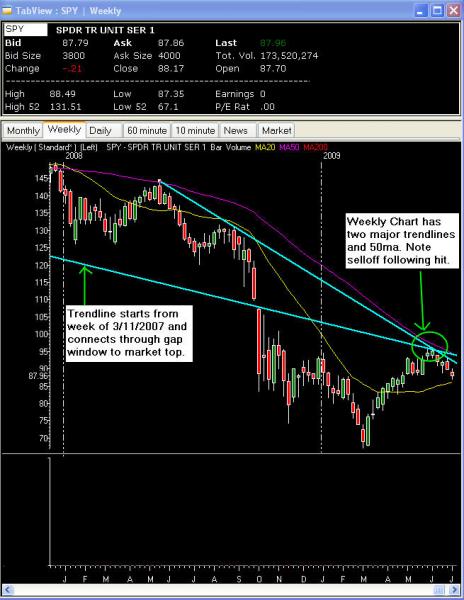
After analyzing the daily chart, it was not clear if we were right to suspect a drop coming in the markets off the SPY $94-$96 level. At that point we went to the next biggest time frame, the weekly. We grinned with excitement after going over the weekly chart. Not only was the 50ma coming into play as major resistance but we discovered two major trend lines, one which started back in early 2007 and the other from mid 2008. Both lines crossed the current price on the SPY at $96. This was a major find and began to reassure us that a fall back down was on the horizon. See the chart below.
After isolating all 3 major resistance levels, which the current markets were hammering against, we began to put all the pieces of the puzzle together. Society was far too bullish, the markets were 40% off their recent lows and the weekly chart was showing hardcore signs of a major pullback. Before we really wanted to short this market and make the call to our premium subscribers, we decided to confirm even more by going to the monthly chart (the next bigger time frame). If we were right on this drop, that should confirm the weekly.
We looked over the monthly chart. All of a sudden, that same smile crept to our lips. Amajor resistance level had just been tagged at $96 on the SPYon the monthly chart dating all the way back to late 2002. It just so happened to be the pivot high of a W bottom. That high in December of 2002 was at $96.05. The high on the SPYin 2009 in June was $96.11. This confirmed our view that the markets should see a sizable drop. See the chart below.

Insane amounts of resistance were being hit on the markets. While those that just focused on the daily chart and listened to the media and our President, Treasury Secretary and Federal Reserve Chairman would have been fooled, those that took the time to analyze the bigger time frames could have nailed this pullback from $96 on the SPY to the recent low at $87. We encourage all of you to start doing this. Confirm yourself on any chart by looking at the bigger time frames. The money tree is available, the question is, will you find a way to reach the branches.
By: Gareth Soloway
Chief Market Strategist
InTheMoneyStocks.com
The Leader In Market Technical Guidance

