
By: Evan Lazarus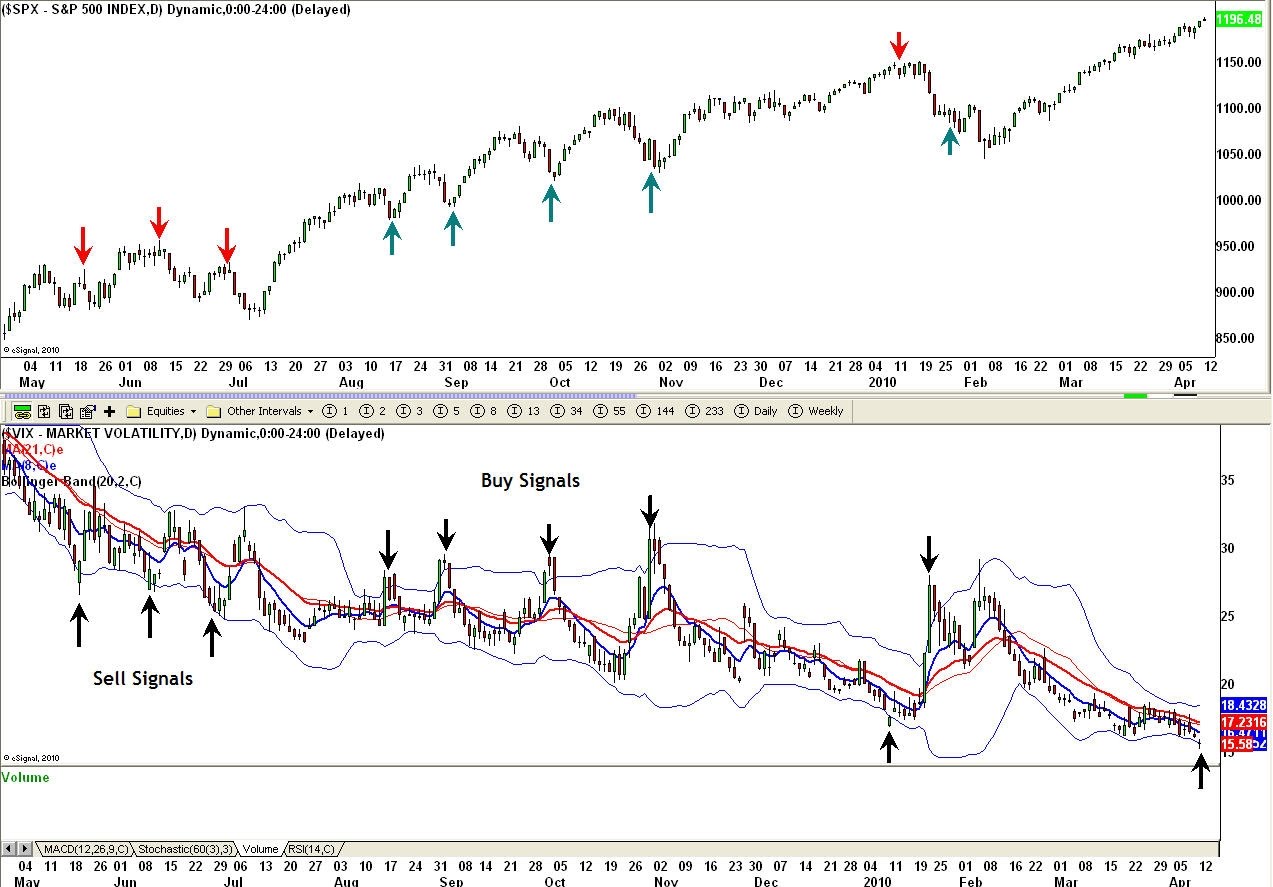
We have had a fair amount of success using the Volatility Index (VIX) to identify multiple directional changes in the market. Although sometimes for only brief periods of time, this indicator has been fairly accurate in allowing traders to identify areas where turns can occur.
When the VIX closes outside its respective Bollinger Bands it usually constitutes a buy or sell signal depending on where the close occurs. Yesterday, we saw a close outside the lower band which would signal a sell when the index closes back inside the band.
You can see how the S&P index has fared with these closes outside the bands going back multiple months.

