
Hot Stocks Outlook for the Week of June 7th, 2019
The Hot Stocks Outlook uses VantagePoint’s market forecasts that are up to 86% accurate to demonstrate how traders can improve their timing and direction. In this week’s video, VantagePoint Software reviews forecasts for Newmont Mining($NEM), Hershey ($HSY), Kratos Defense($KTOS), Gamestop ($GME), and GAP ($GPS).
This Week’s Hot Stocks Outlook
Good afternoon traders, and welcome back to the Hot Stocks Outlook for June 7th, 2019. Hope you are having a great week in the financial markets, and as always, there is plenty to cover.
Newmont Mining($NEM)
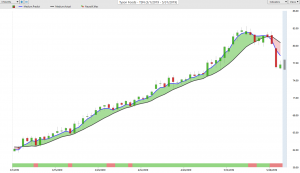
So, we’re going to start out here with Newmont Mining and then spend a little bit of time on several stocks that we looked at all throughout the month of May, and then we’ll end it here on the defensive sector with Kratos Defense and Security. But starting here with Newmont Mining, I want to just highlight how these forecasts work within the Vantagepoint software, and what we have here is daily price actions. These are all daily bars and candles going back, we can see here towards the midpoint in May, and against that price action, you see that there is a black line and also a blue line on the chart.Now, the black line that you see there, that is what we refer to as an actual or regular simple moving average, and how you plot that line is very simple. You just take the past 10, 12 closed prices, however many days you want to take. Add those all together and then divide by that number. But the problem is that value only looks at the past prices of, in this case, Newmont Mining, and it’s always just going to react to what the market has just done. And so, it really has no predictive power and doesn’t allow traders to get ahead of really great trading opportunities.But what we’re able to compare that value to is this blue line that you see against the chart. And this is very important because for this value to be generated, Vantage Point is performing what’s called intermarket analysis. So, it’s not just looking at shares of Newmont Mining here, but it’s looking at obviously very important things like different ETF groups, the gold, silver and metal markets, the S and P 500, the dollar index and currencies. It’s able to analyze all of those Intermarket relationships and then generate future data, so future prices that haven’t yet occurred, and build that into these values, making them much more reactive, much more predictive. And whenever we get that blue line crossing above this black line, it suggests that average prices are going to start moving higher, and you’d, therefore, would want to go ahead and look to take a long position.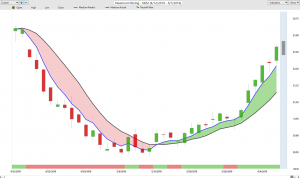 Now, in addition to this indicator being driven by that artificial intelligence, is neural networks that are generating those future prices, we also have a couple of other indicators that you see at the bottom of the chart. Now, these green values, it re-updates every single day. And what it is, is it’s a 48-hour indicator of strength or weakness in the market. And this is what’s called the predicted neural index. So, it’s very short-term strength or weakness in the market. And lastly, you’re provided a predicted trading range for each and every trading day. So, we can actually see how accurate each one of these predictions are against the actual price data. So, at the end of today’s trading day, what we’re going to do is get a new actual candle filling the space, and you can see how accurate those are.Now, when we go ahead and take a look back here, we can see that back here on March 14th or actually May 14th, we get that crossover to the upside, and it suggests look to start taking long in the market, and this was a perfect time to get long. We’ve seen gold, silver, a lot of these metal markets start to move higher, and you see that you also get these predicted trading ranges. So, on this first trading day, we don’t quite get to this level, but it’s only a day behind it that we’re coming down and testing that level, testing it again, testing it here, here, and there’s plenty of opportunities along the way to buy at the lower half of that range, and as a short term trader, you can target the upside, or as a trend trader, make sure you stick with that position.And so, this has been a really great opportunity, and you see that what happens when you get this neural index down at this red configuration, you may have some weakness over those next 48 hours. You see we’re trading well below the close when that signal came through. But the trend’s still very much to the upside. So, really great opportunity here in shares of Newmont Mining and really just across the metal space here. We see getting in this predicted low, you’re up over 13% in just really a few weeks time here. It’s not a very long period of time and a really great entry in a very volatile market where if we start seeing gold start spiking, the equity markets are obviously showing a little bit of trouble here. And so, I don’t think we’re out of the water yet here in equities. And what we need to really highlight is, over the last month, really that month of May, these are three stocks that we brought in and said, “Look, these markets are in down trends. These are great areas to go ahead and look to take a short position.”
The Hershey Company($HSY)
Well, not Hershey here. It’s actually the opposite to the upside. But shares of Hershey. This is one of the few spots where we said, “Look, there’s some strength here.” We’re highlighting the longs even through that last month where we were seeing a lot of shares pull back. And again, this is an area where if you’re going to be coming in and adding to a position, want to do some short term trading here, well where do you want to come in at those levels? How do you want to make those adjustments? And you see you’re getting really great prices, but understanding that the trend is still to the upside, and you don’t want to miss out on this big rally higher, a great place to go ahead and be long over the past couple of weeks, while those retail shares are really, really getting hammered here.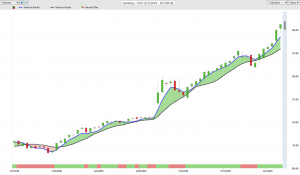
GameStop($GME)
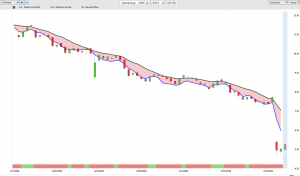 But GameStop and Gap, if you go back and watch those previous Hot Stocks Outlooks, look what’s happened in these shares. So, even if we come in at this point, and we’re saying, “Okay, well how are we going to be trading GameStop?” Look towards those predicted levels to give you that guidance and say, “Okay, well we definitely want to be short, but where do we want to be shorting this market?” And you see just over the past couple of weeks, three great entries on the short side there, and things really falling off in a lot of the retail space. So, down at 36% here in just the past six trading days with a Gap down. But this started a long, long time ago. We can see that overall, the market pretty much cut in half, down over 50%, and so there’s certainly, there are these danger zones out there in the market. And so, you see a few sectors, those being really consumer staples, defense, utilities, that’s where there’s some strength, but almost everywhere else is showing some real problems. And certainly, we move back to a Gap here with retail shares. Crossover to the downside here. You see, you get some volatility over this time period, but you don’t want to lose sight of the bigger picture.
GAP($GPS)
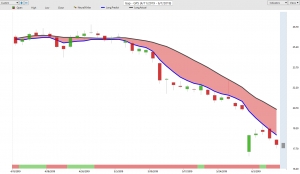 And so you’ll get these areas where, hey, there may be a rally here over those 48 hour periods. But those are great times to set short positions with the help of your predicted high and predicted low ranges, and you can have limit orders just waiting … You have all these values the day before the trading day comes in. So, you can have limit orders waiting at these levels, adding position along the way. As long as that trend is still to the downside, you want to stick with that trade. And we see just even after this Gap down, these levels really adjust very quickly, and you see nailing those predicted highs another great trading day to be short the market there. But overall, shares here really getting hammered, and you want to find those places to certainly hedge the portfolio. So, we did highlight some of these areas where there’s some bullishness, but not here. Down over 29%, 30% in just the past 36 trading days, about a month and a half time here.So, over 21% rally to the upside here in Hershey. And again, those consumer staple stocks doing pretty well. Utilities. But that’s more of a defensive play, right? I mean this doesn’t suggest that there’s a huge amount of market strength, and personally, I’m a little of the opinion that even with this last couple of days of strength, we’re, again, not out of the woods here. We’ve got some issues here with a lot of stock spread around a lot of different sectors of the market. And we look at things like defensive stocks here in Kratos make a lot of military equipment and hardware, things like that. Well, crossover to the upside going back really a month and a half ago here, our midpoint in April there suggesting, hey, this is a good place you can be long.Even when the markets really started pulling back and getting volatile, this is saying, look, here’s a place where you can be long. There’s some real opportunity here. And of course, use that guidance from those shorter-term tools. So, not only get in good on the overall trend but , make sure you’re making good decisions here and not chasing markets that are moving away from you. Stay patient. Like on a day like this, you move up. It says, Hey, wait until you get back to down in these predicted lows. There are some better places you can go ahead and buy into shares.
Kratos Defense ($KTOS)
 You see multiple entries along the way there where you’re making money pretty much every day as this market moves up and hopefully have some short positions to where you can make money on the downside. And really, regardless of if this volatility really kicks in, you’re going to be making some money with your trading here. So here in Kratos Defense a 46% move to the upside here. You’ve got 46% here, 20 plus percent here, down 50 over here, up 15 or so on Newmont. You’ve got some great opportunities here, but you, of course, want to manage those opportunities as those trends start to break out and start to move.And what’s really helpful is you really see a lot of similar conditions on similar stocks. So, when these crossovers come through, especially on the downside on a lot of these retail areas, you see it pretty widespread. We brought in things like Kohl’s, Nordstrom, not areas of the market where you want to be long and a great place to buy put options, get some protection, and do a good job dealing with this volatility and really capitalizing over it as it’s really been a fantastic trading opportunity for those who are ready and awake and ready to go ahead and to put some of these positions on.So, once again, this has been our Hot Stocks Outlook for June 7th, 2019. Thank you all for watching. Best of luck to the traders out there in the markets. And bye for now.

