
Hot Stocks Outlook for the Week of May 10th, 2019
The Hot Stocks Outlook uses VantagePoint market forecasts that are up to 86% accurate to demonstrate how traders can improve their timing and direction. In this week’s video, we analyze forecasts for Genuine Parts Company ($GPC), American Axel Manufacturing ($AXL), Garmin Manufacturing ($GRMN), Anika Therapeutics ($ANIK) and The Hershey Companies ($HSY).
This Week’s Hot Stocks Outlook
Good afternoon traders. Welcome back to the Hot Stocks Outlook for May 10, 2019. Hope you’re all having a excellent week out there in the financial markets and as always, plenty to cover here, really continuing on a lot of these themes we’ve been talking about over the past couple Hot Stocks Outlooks, the weakness in crude oil. And now we’ve seen that weakness set into stocks more broadly here. So we’re going to take a look at Genuine Parts, we’ve got American Axle and Manufacturing, Garmin, Anika Therapeutics and also Hershey here.
Genuine Parts Company ($GPC)
So starting here with Genuine Parts, and again, manufacturing, crude oil, a lot of these things and really very broadly seeing that weakness, but a lot of these areas very clearly had come through quite a while ago saying, look, there’s some areas out there you want to go ahead and get short. Then you see things really accelerating over the past week here. But with Genuine Parts you see that we have this black line and this blue line right up against daily bars, going back really the past month here in this individual stock here. That black line that you see on the chart, that is what we call irregular or simple moving average. It’s a very common technical indicator, very easy to plot on a chart, pretty much available in any sort of platform you’d have.But the problem is is that all it does is really plot past prices, looks at new closed prices coming in and it only looks at the one market in isolation, in this case Genuine Parts. But what we’re able to compare that value to, so that value that really tells you where prices have been, we’re able to compare that to this what’s called the Predicted Moving Average. For that value to be generated, Vantage Point is identifying really about 30 to 35 different markets and how they affect and influence, in this case, Genuine Parts.So that can be ETF groups, that can be individual stocks, currencies like the Dollar Index, indexes like the S&P 500, NASDAQ. What it’s able to do is taken all of that information and determine how these markets are going to influence and affect the future prices of Genuine Parts, because we have a completely global and interrelated market and you can get very valuable clues from other markets. There’s a lot of leading and lagging relationships. This is where this technology of neural networks has a huge advantage over not having a technology like this and not analyzing these inner market data relationships.So what happens is when that blue line or that predicted moving average moves, in this case, below the actual moving average, it’s telling you that average prices are expected to start moving lower. Essentially the trend direction is down and you’d want to look to go short. 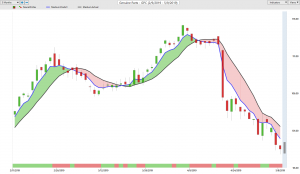 Now in addition to that predicted moving average, you see that we have this red and green indicator at the bottom. This is another indicator generated via the neural networks found within Vantage Point, and again, doing that intermarket analysis. However, there are tuned to forecast over the short term. So 48 hours of short term strength or weakness in the market, really a great thing to understand if you’re short the market, when some short term strength may come in but doesn’t mean get out of your position. Actually, it would suggest short on those rallies that you may see over the next 48 hours.And lastly, you’re given a predicted high and predicted low value for the next trading day. So before the trading day even occurs, you have these predicted values. You’re going to see how accurate they are moving forward in a stock like here, Genuine Parts. They go ahead and bring up those predicted high and low values, and what you understand is if you want to be short and you’ve got that directional bias on the market, you know where you want to be shorter, you know where you want to be long, now you’ve got a roadmap that says, okay, well where should you be taking positions on this market so that you’re not chasing the market, you’re not getting inferior prices, and you see multiple entries here in this downtrend and great opportunities to again, add to your position. And you see within a couple of trading days some gaps happening and those markets moving into profit. Overall, fantastic move here.I can’t say this enough but we’ve really been highlighting this, we’ve really seen a lot of weakness over the past month here. It hasn’t been evidenced in the S&P. You’ve sort of seen it crawling higher and higher, very, very slowly. But there’s definite weakness out there. Then you see within a week, all of that month’s profits are really taken away on the S&P or all of those gains from the S&P gone very quickly. If you have those areas to get short, that’s where you really make a lot of money when the overall markets accelerate to the downside. So we see about a 13% move just in the past month here on Genuine Parts..
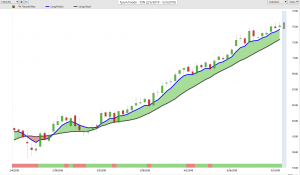 And as a trader, very simply, we want to go ahead and get long the market. Now, as long as that blue line remains above the black line, the trend is still up. Now, what’s important understand is with a predicted moving average, what is an average, right? You’re going to trade above and below that average at times, but as long as you have this separation between that blue and the black line, that trend is still up. Now, in addition to that a predictive indicator, you’ll also see that there’s a green and a red bar at the bottom of your screen, and this is the predicted neural index. And what it’s doing is it’s a very short term forecast, so looking ahead 48 hours, and it’s often a really great time when you’re in an uptrend to understand when some weakness is coming in. So as long as that blue line is above the black line, you can again look to go ahead and get long, but be prepared for that weakness ahead of time.And, lastly, to really round out the entirety of these forecasts is the predicted high and low range, which is actually a predicted trading candle produced before each and every trading day. So you see before this trading day comes in, you’ve got a prediction of the high, a prediction of the low, and that’s what you can use to manage these trades as the market rolls forward. And you see how this works, that if you’re ready and prepared to be a buyer at these predicted levels, you’re getting picked up and almost immediately these markets are moving into profit here. And again, as long as that blue line or that predicted moving average is above the actual moving average, you want to maintain that position. It’s telling you that the trend is up.So you see here about seven, eight, nine entries or so and a fantastic opportunity where the markets are essentially moving straight up. And you see this second candle here would have been a day where you’d be looking to be a buyer. Markets up almost 18% in just the last 39 trading days. So really about a couple months time here. Now, it’s important to understand though that it’s not all strength in the market. While the S&P has looked very strong, there is some weakness out there. And so you want to find those areas where you can actually look to go ahead and short the market.
American Axel Manufacturing ($AXL)
Moving onto American Axle and Manufacturing. Very similar story here, crossover to the downside neural index at a zero. You see that you’ll get these periods where the neural index will move up to a green configuration and you see things sort of run sideways, but you’re actually getting bigger separation between that predicted moving average and the actual. And of course you want to be short with that predicted moving average below the actual saying the trend is now down. And you see how this works out. Again, great opportunities to short the market. You see you get some volatility, but within two trading days you are well below your entry price. Here a day where most people don’t want to short at the close there, you’ve got to limit order waiting to add to that position and really great opportunities again to exploit the downside of this market if you’re long. We talked about things like Tyson foods. There are these areas that are very, very resilient right now and are moving up even as the S&P starts to go lower.But you want to go ahead and take those short positions so that you’re making money on both sides of the market. Then when volatility really slams into things, you’ve got things that are really working out for you. So American Axle and Manufacturing down at 20%, over $3 per share on a $15 stock where they buy put options to short the shares, making a lot of money in 12 trading days. So really what, two weeks essentially, three weeks of time here, really making a lot of money and having a great entry on the short side of this market.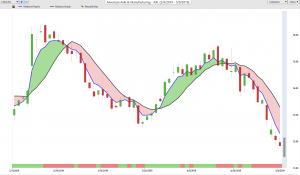
Garmin Ltd. ($GRMN)
Moving forward to Garmin. You see kind of a theme here. You’ve got manufacturing. Garmin I’m sure it gets a lot of these parts and things like that from China. None of this is really fundamental analysis. It’s really doing the analysis in the background. But then we see things like fundamentals hit the market and you see really things start to get exaggerated. But it’s not predicting what’s going on in the future or what’s going to happen next. It’s simply using these tools to guide you forward with your trading.You see here Garmin, you have a crossover to the downside, again, mid-month last month, the blue line below the black line. You’ll see again this neural index that it will come in and let you know when there’s going to be maybe some weakening of the trend, but you see a lot of separation still between that prediction of the moving average, which I always say you can trade above and below an average. You should expect prices to move above and below an average. But don’t lose sight of the bigger move here in the trend and you see what ends up happening. We have great opportunities to be shorting at these predicted high levels and then a little bit of news comes out and things can really accelerate in your favor here, but you need to get ahead of those things. Be in the market and take those positions ahead of time and a really great opportunity, again here, as we see the market gaps down, things getting very weak. Off about 10% just in the past few weeks of trading there.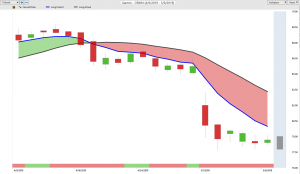
Anika Therapeutics ($ANIK)
Now there are some areas of the market where there’s still that strength. We talked about really the food production stocks like Tyson, I think it’s McCormick, mixed spices and things like that. You’ve seen those stocks do really well. So those areas you can be long the market, but you want to make sure that you have that roadmap and that go-ahead from Vantage Point that says okay, here’s an opportunity for you.Here we’ve got a Anika Therapeutics. You see this crossover to the upside, just a ton of strength from the neural index here. You see over the past, really more than a month time, you’ve only had three days where the neural index has been down at a zero. You see a little bit of a gap down here, a little bit of a gap downs from when those areas come through, but the blue line still well above the black line. And you see even as the market experiences weakness, a stock that has this bullish forecast is doing very, very well. You see your initial entry coming all the way back here at the beginning of the trade and things just really exploding to the upside. This market up 33%.So just understand that this is when the overall market S&P and all that’s doing very weak. Well, what does Vantage Point telling you about this stock? It’s going higher. Don’t be short here. Here’s a place where you can be long and make a lot of money as that market accelerates here. Over 30% move in just 25 trading days. $10 per share, obviously you buy just 1,000 shares. Doing very, very well here as that market explodes higher. Over $10,000 just really in a few days as this market moves higher.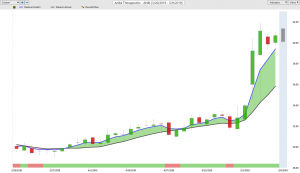
Hershey Companies ($HSY)
And again, I want to touch on Hershey. So we looked at broadly the areas that are doing weak, like energies. We went through that last week of all those energy stocks and we see crude oil just completely reversing to the downside, off about 10% over the past couple of weeks now. But here’s Hershey here. Crossover to the upside, neural index strongly there at a one. You’ll see you get these areas where, again, you see this, you’re getting lower lows coming through after these neural indexes, but not at an area to get out of the market. Really an area to buy on these dips. And you see a great opportunity. You see again, neural index bearish it, all the way here saying expect that retracement. But look how accurate these predicted highs and lows are.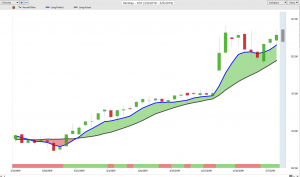 So even when you get this volatility around this area, look how quickly these predicted highs and lows adjust so that you can be making intelligent trading decisions and getting the most out of that trading opportunity. So very similar to Tyson and McCormick and some of these, again, these food production, sort of these grocery stores stocks. Up 11% in just 32 trading days. So just fantastic opportunities. Again, this is not something we haven’t identified over a long period of time. Every single week we bring in the same markets in the same sectors and that’s where we’re seeing a lot of the strength. Then also this weakness that we’re really seeing play into the broader S&P 500.So great week to be Vantage Point users. Thank you all for watching. Best of luck to the traders out there in the markets. Again, this has been our Hot Stocks Outlooks for May 10, 2019. Best of luck. Thanks again and bye for now.

