
Hot Stocks Outlook for the Week of May 31st, 2019
The Hot Stocks Outlook uses VantagePoint market forecasts that are up to 86% accurate to demonstrate how traders can improve their timing and direction. In this week’s video, we analyze forecasts for Abercrombie & Fitch Co. ($ANF), General Motors ($GM), Taiwan Semiconductor Manufacturing ($TSM), Tyson Foods ($TSN) and Boston Beer Company ($SAM).
This Week’s Hot Stocks Outlook
Good afternoon traders and welcome back to the Hot Stocks Outlook for May 31st, 2019. Hope you all have had an excellent week out there in the financial markets and there’s always plenty to cover this week in the Hot Stocks Outlook.
Abercrombie & Fitch ($ANF)
We’re going to start out here with shares of Abercrombie & Fitch. We’ve got General Motors, so automotive there. Technology in Taiwan semi conductors, Tyson and also Boston Beer, which we’ve highlighted a lot of the strength in those consumer staples, but things are shifting out there in the market place.Taking a look starting here at Abercrombie & Fitch, we see that what we have here is the daily price action. Each one of these bars represents a full and complete trading day. And against that price action, you see it there’s a black line and also a blue line. The black line that you see there on the chart, that is a regular or simple moving average. We refer to it as the actual moving average.And what it does is a very common technical indicator. It just plots previous prices, adds them all together, divides by a certain number and moves that line moving forward. But the problem with an indictor like that, is it’s really just informing you of where the market has been and of course as traders, we need to understand where the market is moving next. What we’re able to compare that value to, is this blue line that you see on the chart. And for that value to be generated, vantage point is looking at up to 30 to 35 different markets that are known to affect, drive and influence shares of Abercrombie. The shares of this individual stock, is going to share extremely important information with things like, retail ETFs, other individual stocks within the retail space, things like the dollar indexed, interest rates, global stock indices. And there’re some extremely valuable information that can be derived from those inter market relationships, but you have to use the technology of neuro networks. It is a type of artificial intelligence.All that analysis is done, to generate these values ahead of time and create a predicted moving average, to let us know where prices are moving going forward, which is obviously what we need to know right? As soon as that blue line crosses below the black line, it’s informing you that average prices are expected to move lower, right? And so, when we actually have that indicator, it gives us a very clear guidance of what direction do we want to be trading the market. And we can see that overall, this market has moved down tremendously down about 37% after this big gap down that we had just the other day. Now, what’s important to understand here though, is that’s not the entirety of the vantage point focused here. We’re also provided with extremely valuable information, like the predicted neuro index, so this indicator that’s either green, in can move to a red, it’s a extremely accurate 48 hour indicator. Upwards of over 80% accurate and this is over all market conditions. Through earnings reports, through fed statements all of this. This indicator is consistently over 80% accurate forecasting those next 48 hour windows. In addition to that, you’re actually provided a predicted high and low for the next trading day. You have the trend direction, short term strength or weakness and also, very important trading levels provided to you way ahead of time here. You see that we hit this predicted high on that trading day, see a lot of weakness for the neuro index signaling that this market’s likely moving to a down trend. You get your crossovers and these are the things I really love to point out here. Do you see that neuro index comes up to a green configuration, and it’s saying, hey there’s some strength over the next subsequent 48 hour period. But that’s a great time to short up near those predicted highs there, right? Anticipate that strength, but you know that that blue line, or that predicted moving average, is well below the black line.You see here again it’s saying, expect some strength coming into this trading day, but look what happens here, right? You get a lot of strength, you move higher but look where the close comes in. Market comes all the way back down, and closes below that predicted high level. And this gave you numerous opportunities to go ahead and short the market, well before this market moved lower. And the overall trend obviously, very weak here.
General Motors ($GM)
But a lot of the move here, you don’t have to run a huge stop loss at all, to participate in a move like this. You’ve got a predicted moving average way down here, you’re shorting well above it, and the market never gets back to that level. Moves down about 30%. Looking at General Motors here. We’ve seen just overall a lot of weakness in the market. And we’re going to get to these consumer staples here, but along with utilities and consumer staples, we’re doing pretty well. But now, everything is getting pretty weak here and you definitely want to go ahead and be short the market.Here in General Motors, we have this crossover to the downside, the neuro index is what you want to pair with that one, those crossovers come through. And you see what occurs here, same thing, saying okay, well the trend is to the downside. If you’re actually shorting at these predicted levels, you see in days like these, we actually come up to this previous day’s level. You’ve traded straight down and next day you gap right up to that level.But if you’re actually setting limit orders at these levels, you’re going to get filled right at the open in that day. We have another level achieved right here. One of the tough things is, you’re going to often times be shorting on bullish days. And get that position on, because you see that almost immediately, this thing is going to start moving lower.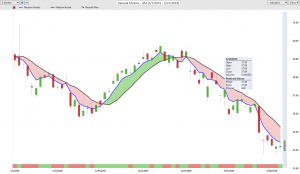 Again here, you get filled at the predicted high, you get filled there, filled here. Multiple opportunities to short the market along the way and as long as you develop a strategy where you can deal with volatility over this 48 hour windows, you’re going to be doing quite well. As you can deal with that market volatility, stick with the overall trend direction, but make sure you get that direction right. Right?
Taiwan Semiconductors ($TSM)
I mean, stick with these predicted moving averages. You’ve got a 14% decline in shares of General Motors and obviously a lot of other areas in the market are seeing this decline. Here in TSM, so if you look at things like the XLK, ETF, Nvidia. A lot of these shares are really getting battered here and it’s definitely a great time to come in and short. We see again this crossover to the downside, going all the way back to really before the month of May. Saying, this is not an area where you want to belong, use your vantage point tools, to go ahead and get short the market.Again you’re shorting here, shorting there, plenty of opportunities along the way to add to this position. And understand that, there’s only one direction here that you can be trading and that’s to the short side. And you see how these tools really work out, where you’ve got this crossover to the downside, but the neuro index is telling you, hey expect this strength to come in, but the blue line is still below the black line.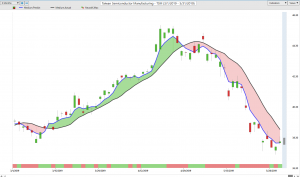 That’s actually a great opportunity to short, don’t get shaken out by the volatility and make the most of these opportunities that we’re seeing out in the market place. Again market down over 15% and previous Hot Stocks Outlook, so really over the past several weeks, been highlighting that it’s time to hedge that portfolio, it’s time to go ahead and actually get short the market, buy some put options and get some protection.
Tyson Foods ($TSN)
And there’s very few places to hide. One of those places that were doing quite well, were the consumer staples and also utilities and that has even shifted. It’s seeming that there’s really no place to hide from market weakness currently. And we see here, that with Tyson’s Foods, we’ve covered this extensively over this run up, but great opportunities all along the way to be buying up shares of Tyson Foods.But you want to know when to go ahead and take those profits and move on to something else and you see just over and over. I mean, this predicted low is getting hit immediately, the market moving in your favor. But things radically shifted pretty much after this trading day here. Go head, go back to those predicting moving averages and saying, no you’re done, get out of the way, this is no longer the market that you want to go ahead and participate in.A great rally to the upside, but to preserve that 28% rally with numerous addition points along the way, you’ve got to understand that take those profits, get out of the way, and don’t sit around for this huged red candle that we have here on the chart as things start to move lower. Boston Beer. Another one of these examples where consumer staples things like JM Smucker, Tyson here. I mean, there’s grocery store stocks doing very well, but things are shifting.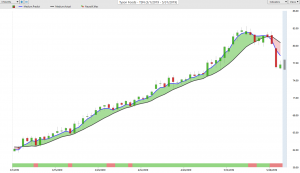 And we actually focus for things like the ETFs and you just see all of this weakness coming through. Really all of the sectors of the market and there’s just no reason to belong in these areas. But on the way up, great opportunities to be adding to the position, but then realizing look, this is over, get out of the way and actually I believe you’ll be shorting from that level right there. You can go ahead and bring those predictive moving averages back in. I mean, you get these crossovers to the downside, and you’re coming in and reversing your position.
Boston Beer ($SAM)
I see the market off already five percent as shares decline and just a tremendous amount of weakness, as you see the separation between these predicted averages, getting wider and wider, neuro index showing no sign of strength in the market. It’s been a really great ride during this year. We had four months of pretty much straight up trend. Crude oil did well, but we’re seeing as crude oil reversed, so did the energy stocks. And then it seems that the SNP is following crude oil. And you see we had that six percent move lower the other day in crude oil last week.Well, you really got to watch out for these stocks, because there’s not really any places to go ahead and look to push long positions. And you’re really looking to give back a lot of profits if you’re not getting out of the way, but there’s tremendous opportunities to make money to the downside here, by shorting the market, buying some put options and really being ahead of a lot of this weakness and markets and entire sectors really starting to turn here.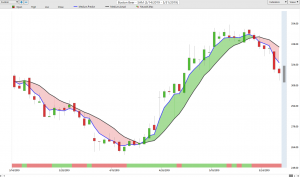 Have a great rest of the week. Thank you all for watching the Hot Stocks Outlook. Have a great week, thanks again and of course, bye for now. This has once again been our Hot Stocks Outlook for May 31st, 2019. Have a great week guys.

