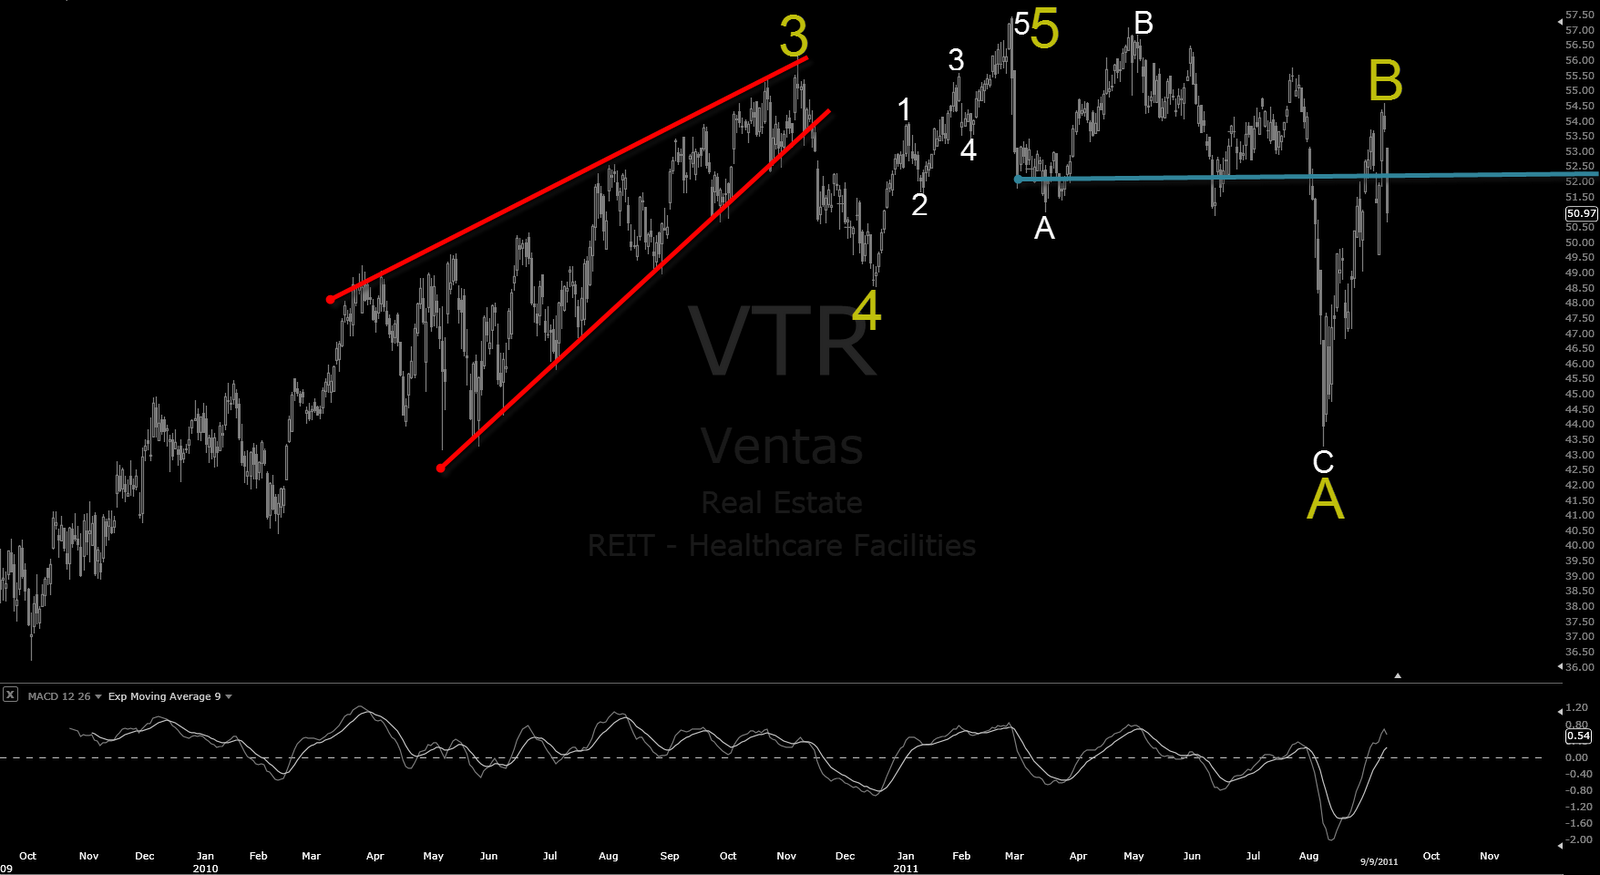
Blue line is interesting, this line is where traditional TA analyse traders will go short and once its broken for upside, they are stopped. The reason for it is that they threat this top as triangle, sideways triangle while in traditional EW one could fill ABCDE contracting triangle for it IF we would breake the rules of the theory and starting making that triangle from actual top.
For Neely EW theorist, this is bearish top triangle ( not the one which is ending the third wave ending diagonal which I marked as red), but this actual sideways top triangle where chart did crack first stage at all. Its Neely EW bearish triangle, the SPX had it before that major flashcrash with daily chart, you propably remember when even names like Apple took huge hit in one day which eventually was bought during the same day. It was generated when some major Kansas City fund placed a lot SPX future contracts for sellside.
Looks for me shortside stops has been taken out with this.
But all in all, this reminds to a bit as wedding party chart, one need to stamp this once to breake it like chrystal glasses, might sounds a bit strong express. The actual falling divergence can be seen best from the weekly chart. The lowest one is monthly and upper one as daily chart.