
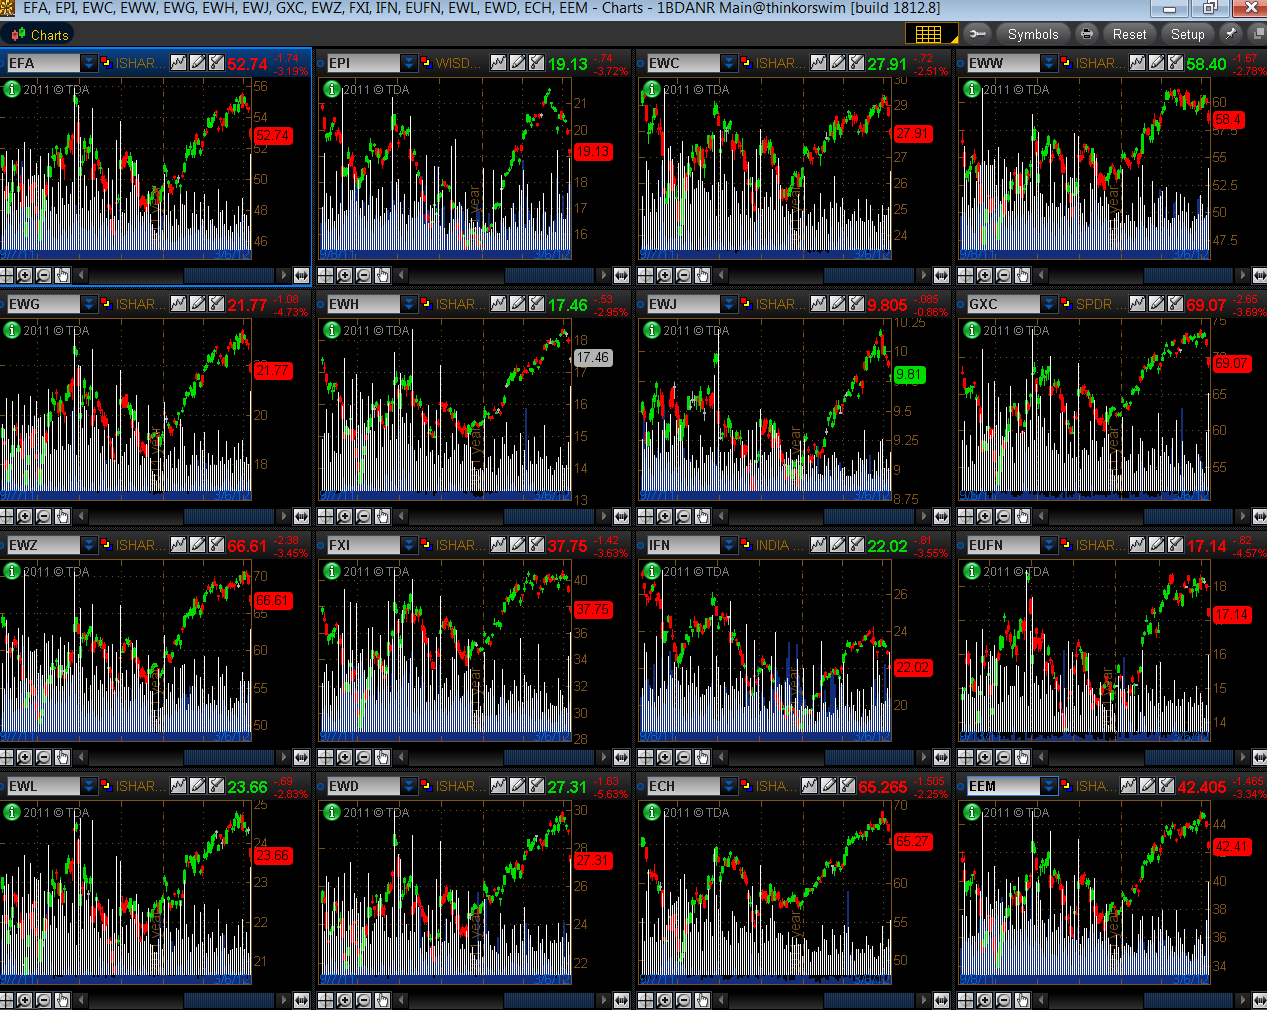
Today’s gap-down “shock drop” in Foreign ETFs was accompanied by a big volatility spike in each one at levels seen in September/October 2011 during large declines in these markets, as shown on the Daily chartgrid below. Volatility is represented by the white histogram which is overlaid on price.
Percentages lost on today’s trading in…

