
Where we’ve been:
In March, we witnessed the first cracks in the markets armor as breadth began showing divergence.
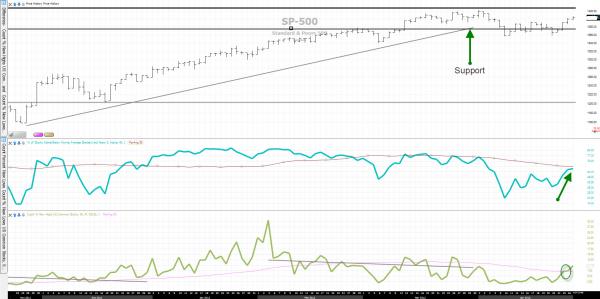
New highs (green line) has been declining since an early February peak. By March new highs began diverging from price. Meanwhile, the percent of stocks making new lows (red line) has flat lined during the advance. Yet the markets pushed to a new intermediate term high.
Market Breadth Daily % Stocks above 50 day moving average and percent making new highs (see 05/01/2012 chart 1 below).
Breadth Indexes created on StockFinder, subscribe here http://volumeanalysis.com/ & click StockFinder.
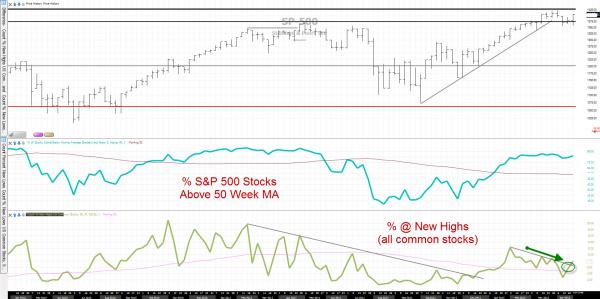
Breadth Intermediate Term (Weekly) (see chart 2 below as 05/01/2012).
Breadth Indexes created on StockFinder, subscribe here http://volumeanalysis.com/ & click StockFinder.
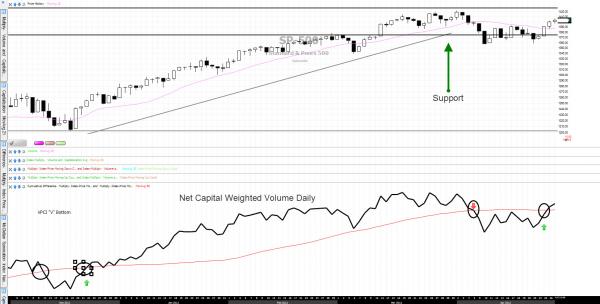
By April we experienced the first breaks of the cap weighted daily volume trend of 2012. More importantly, our volume-trend momentum indicators the VPCI (Volume Price Confirmation Indicator) and TTI (Trend Trust Indicator) showed signs of turning over.
1st Daily Cap Weighted Volume sell signal of 2012 occurred on April 5th (see chart 3 below).
Capital Weighted Indexes created on StockFinder, subscribe here http://volumeanalysis.com/ & click StockFinder.
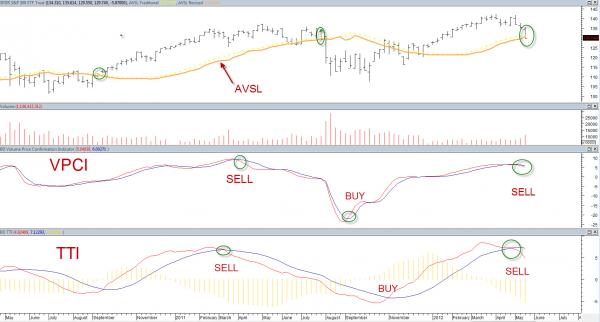
Volume Analysis Intermediate term: Both SPY & DIA weeklies volume indicators turned over (see charts 4 & 5 below as of 5/01/2012).
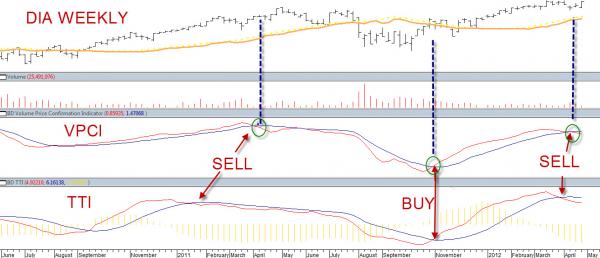
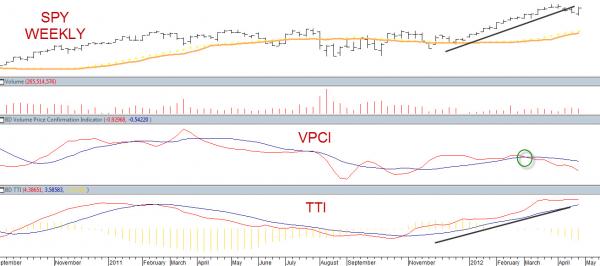
Charts and indicators created on MetaStock, create your own VPCI, AVSL & TTI indicator & charts here http://go.metastock.com/forms/trial?whc=buff&pc=eq-buff
Charts and indicators created on MetaStock, create your own VPCI, AVSL & TTI indicator & charts
Where we are now
Since May we have witnessed signficant damage in the market’s trend and our volume indicators. The Anti-
Volume Stop Loss has been violated on a weekly bases on the SPY (S&P 500 SPDR ETF) as the VPCI and TTI continue on sell signals (see chart 6).
Charts and indicators created on MetaStock, create your own VPCI, AVSL & TTI indicator & charts
Additionally, cummulative Capital Weighted Volume continues its down trend on a daily and weekly bases. The last time the daily cummulative Capital Weighted Volume was this low was back in December of 2011, when the market was at 1240 (see chart 7).
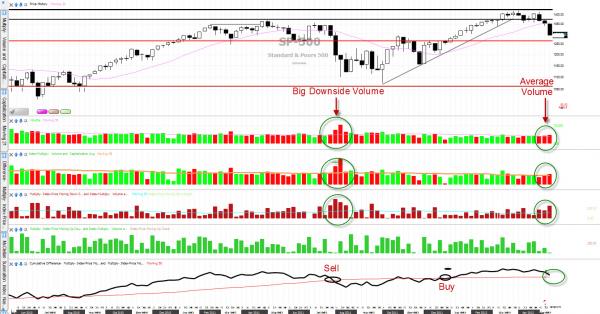
Capital Weighted Indexes created on StockFinder, subscribe here http://volumeanalysis.com/ & click StockFinder.
Where are we going?
Given we are on daily sell signals, a prudent position may be to wait and see before jumping in. The next major SPX battleground could be 1260 where major support resides. But given the weight of the evidence thus far we have reasons to believe the market could come roaring back. First, notice the daily Capital Weighted Volume in chart 8 below. The capital weighted volume is not expanding like you would expect given the price deteriation.
Compare this to the volume of that of August, September, and October. Comparitatively, volume thus far is relatively low.
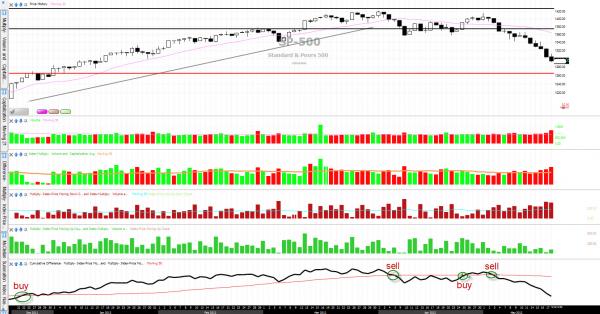
Capital Weighted Indexes created on StockFinder, subscribe here http://volumeanalysis.com/ & click StockFinder.
Next notice chart 9 below. The VPCI has fallen two standard diviations below its mean (Bollinger Band of VPCI).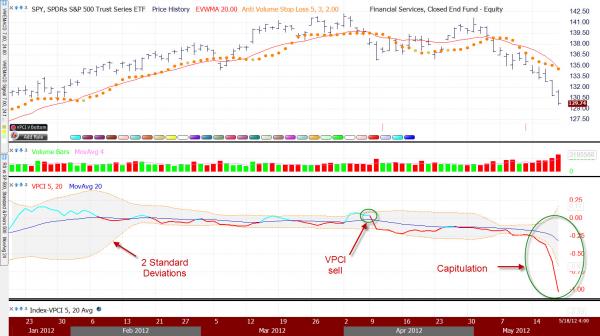
Indicators created on StockFinder, subscribe here http://volumeanalysis.com/ & click StockFinder.
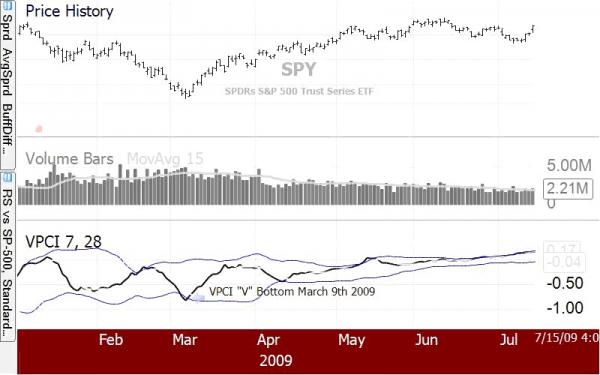
A falling price trend without volume is apathy, fear without increasing energy. Unlike greed, fear is self-sustaining and can endure for long periods without increasing fuel or energy. Adding energy to fear is likened to adding fuel to a fire and is generally bearish until the VPCI reverses. In such cases, weak-minded investors are overcome by fear, becoming irrationally fearful until the selling climax reaches a state of maximum homogeneity. At this point, the ownership held by the weak investors has been purged, producing a type of heat death. These occurrences might be visualized by the VPCI falling below the lower standard deviation of a Bollinger band of VPCI and then rising above the lower band to form a VCPI V bottom. Although VPCI V bottoms are rare, since the development of the VPCI in 2002, V Bottoms have marked many of the major intermediate term capitulation bottoms (see charts, 10,11, and 12).We will be watching for such an event over the coming days to see when this signal may occur.
Chart 11 VPCI “V” Bottom October 5th, 2011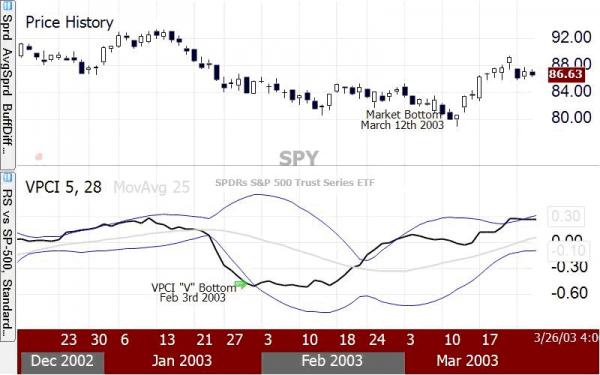
Chart 12 May 2006 “V” Bottom
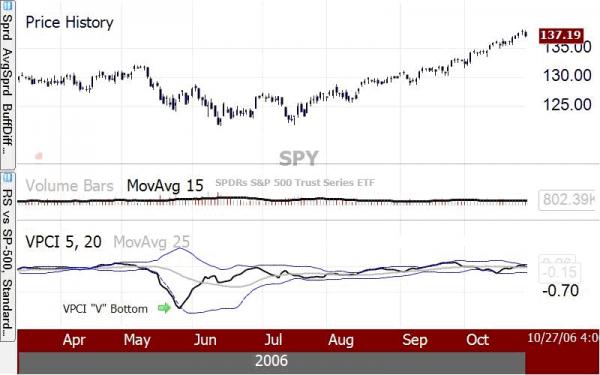
Chart 12 March 9th, 2009 “V” Bottom
Indicators created on StockFinder, subscribe here http://volumeanalysis.com/ & click StockFinder.
Definitions:
Capital Weighted Volume – This is the true volume of an index. It is calculated by summing the volume of each individual index member in proportion to its weighting the index.
Capital Weighted Up Volume – The capital weighted volume of securities closing higher.
Capital Weighted Down Volume – The cap weighted volume of securities closing lower.
Cumulative Cap Weighted Volume – A running total of the cumulative net of CW-Up versus CW-Down Volume.
AVSL Anti-Volume Stop Loss – Proprietary formula taking into account support, volatility and the inverse of price-volume’s asymmetrical relationship.
VPCI Volume Price Confirmation Indicator – measures the asymmetrical relationship between price and volume over the course of time and trends.
VW-MACD – Volume Weighted Moving Average Convergence Divergence
TTI – The Trend Thrust Indicator is an adaptive trend indicator taking both price and volume moments into its logic.
VPCI Indexes – The average VPCI score of each individual index component.
VPCI “V” Bottom – A capitulation signal occurring when the VPCI has fallen two standard deviations below a moving average of itself and then pops back above the lower standard deviation band (Bollinger Band).
For more information on Capital Weighted Volume/ VPCI Index:http://www.traderspress.com/detail.php?PKey=950&affiliate=volumeanalysis)
Disclaimer:
Definitions:
Capital Weighted Volume – This is the true volume of an index. It is calculated by summing the volume of each individual index member in proportion to its weighting the index.
Capital Weighted Up Volume – The capital weighted volume of securities closing higher.
Capital Weighted Down Volume – The cap weighted volume of securities closing lower.
Cumulative Cap Weighted Volume – A running total of the cumulative net of CW-Up versus CW-Down Volume.
AVSL Anti-Volume Stop Loss – Proprietary formula taking into account support, volatility and the inverse of price-volume’s asymmetrical relationship.
VPCI- Volume Price Confirmation Indicator – measures the asymmetrical relationship between price and volume over the course of time and trends.
VW-MACD – Volume Weighted Moving Average Convergence Divergence
TTI – The Trend Thrust Indicator is an adaptive trend indicator taking both price and volume moments into its logic.
VPCI Indexes – The average VPCI score of each individual index component.
VPCI “V” Bottom – A capitulation signal occurring when the VPCI has fallen two standard deviations below a moving average of itself and then pops back above the lower standard deviation band (Bollinger Band).
For more information on Capital Weighted Volume/ VPCI Index:http://www.traderspress.com/detail.php?PKey=950&affiliate=volumeanalysis)
Disclaimer:
THE DATA AND INFORMATION ACCESSIBLE ON THIS PUBLICATION ARE PROVIDED “AS IS” AND THERE MAY BE DELAYS, OMISSIONS OR INACCURACIES IN SUCH INFORMATION AND DATA. VOLUME ANALYSIS LLC, CANNOT AND DOES NOT GUARANTEE THE ACCURACY, SEQUENCE, COMPLETENESS, TIMELINESS, MERCHANTABILITY OR FITNESS FOR A PARTICULAR PURPOSE OF THE INFORMATION OR DATA MADE AVAILABLE THROUGH THE SERVICE OR BY ANY FORCE MAJEURE OR ANY OTHER CAUSE BEYOND THEIR REASONABLE CONTROL. VOLUME ANALYSIS LLC SHALL NOT BE LIABLE TO YOU OR TO ANYONE ELSE FOR ANY LOSS OR INJURY CAUSED IN WHOLE OR IN PART BY ITS NEGLIGENCE, OMISSION IN PROCURING, COMPILING, INTERPRETING, EDITING, WRITING, REPORTING, TRANSMITTING OR DELIVERING ANY INFORMATION OR DATA THROUGH THIS SERVICE OR FOR INTERRUPTION IN ANY SUCH DATA. IN NO EVENT WILL VOLUME ANALYSIS LLC BE LIABLE TO YOU OR ANYONE ELSE FOR ANY DECISION MADE OR ACTION TAKEN BY YOU IN RELIANCE UPON SUCH INFORMATION OR DATA OR FOR ANY CONSEQUENTIAL, SPECIAL OR SIMILAR DAMAGES, INCLUDING BUT NOT LIMITED TO LOST PROFITS, TRADING LOSSES, DAMAGES RESULTING FROM INCONVENIENCE, OR LOSS OF USE OF THE SERVICE, EVEN IF ADVISED OF THE POSSIBILITY OF SUCH DAMAGES. THIS SERVICE MAY BE DISCONTINUED OR LIMITED AT ANY TIME.THIS INFORMATION IS FOR ENTERMAINTMENT PURPOSES ONLY.
Before trading or investing consider all relevant risk factors, including your own personal financial situation. Past performance is not indicative of future performance. Trading stocks forex, futures, or options involve risk and are not suitable for all investors. VolumeAnaylsis LLC, is not an Investment Advisor. Volume analysis produces and distributes impersonal newsletters for stock traders, option traders, and stock investors, via email and/or Internet. All information and services are for informational / entertainment purposes only. Individual trading advice is not given at any time.

