

From the high touched in the beginning of March, the SPX has lost about 3.5% as of Tuesday’s close. No doubt the pundits on TV will declare another buying opportunity, given improved labor dynamics in the US, aided by the decline in energy prices. If stocks climb a wall of worry, then I can describe, not a wall, but a sheer cliff of concerns. For example, profits as a % of GDP are at an historically high level, a situation which is unlikely to continue. US dollar strength is sapping the competitiveness of US exporters. Margin debt is near record highs. The Shiller P/E ratio is at a dangerous level near 27. Stock market cap to GDP is at a level only exceeded by the NASDAQ bubble. US commodities are in a bear market.
However, rather than go into long, dry descriptions of these statistics, likely to be shrugged off by many with a simple, “Well, where else can anyone put their money?”, I will just draw a few parallels between now and 1997/1998 when the Asian crisis and Long Term Capital Management (LTCM) failure threatened to destroy the globe’s financial architecture. First of all, let me note that that in 1997 and 1998, the Fed Fund target was 5.25 to 5.50%. So, the Fed had a bit of wiggle room in those days with respect to using conventional tools to combat market dislocations. Second, note that in late 1998 as the crisis intensified, the Fed did indeed cut rates … from 5.5% to 4.75% (By June of 1999, the Fed was once again RAISING rates.).
So, the following market analogies shouldn’t be construed as to suggest a specific forward path for markets. I just find some of comparisons to be of interest. Let’s start by noting that from late 1997 to July of 1998, the SPX rallied strongly, from a bit over 900 to just under 1200, rather like recent stock market behavior. However, from late July to the end of August, the market dropped 20%. A decline of 20% from the high set in the beginning of March 2015 would put the SPX around 1700.
So what are some of the similarities between the late 1990’s and now? Emerging markets had over-expanded and had seen strong capital inflows. These flows reversed with a vengeance. The Indonesian rupiah and Malaysian ringgit both collapsed. For example, $/rupiah went from below 4000 to 16000. It was the same with the Russian Ruble (sound familiar?), which went from 6.00 to over 20.0 in August/Sept of 1998.
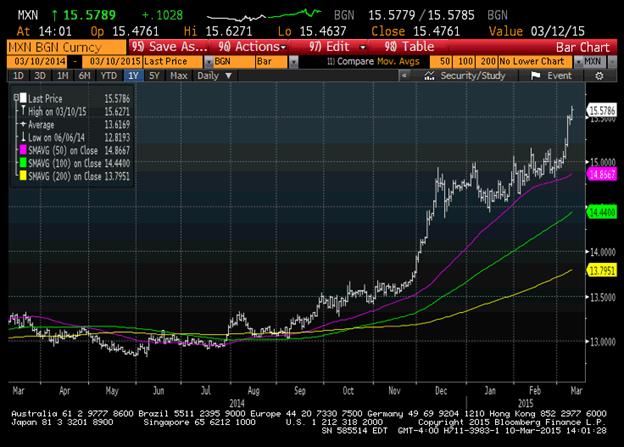
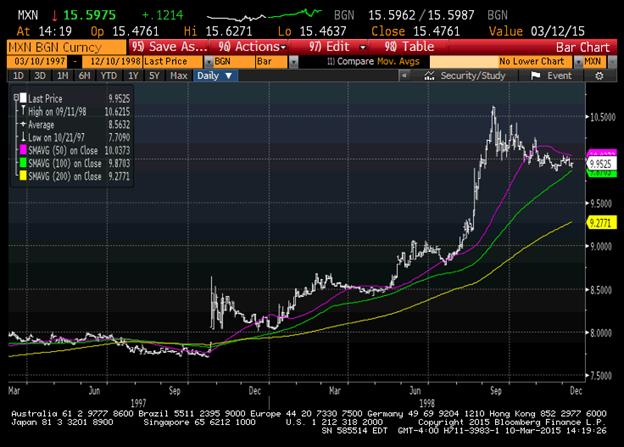
Below are charts of the Mexican Peso from March 2014 to the present, and from March 1997 to late 1998. While perhaps the peso was not at the heart of the crisis, I think the similarity of the charts is telling. By the way, from October of 1997 to December 1998 the front month in Crude Oil was essentially cut in half, from around $20/bbl to $11/bbl. In the current episode, crude has dropped by a shade more in magnitude, from around $105 to $50. In the earlier period, the Fed went to extraordinary efforts to contain the fallout from LTCM’s failure, which was a loss (now considered almost quaint) of $5 billion.
$/PESO from March 2014 to current
$/PESO from March 1997 to December 1998
The broad picture is that emerging market and commodity stress created severe dislocations in the late 1990’s. I don’t recall people referring to “risk-on/ risk-off” at the time, but the dynamic is clearly similar. Deterioration works from the perimeter to the center, often without any attention paid to the incipient signs. Then it catches like wildfire. In the current environment, the public has placed significant trust in the Central Banks to continue the gymnastics of QE and zero (or negative) interest rates. The money flows are gargantuan compared to the late 1990’s. Just a friendly reminder, a 20% plus correction in stocks can happen in a hurry; a defensive posture is warranted.
#####
For more information on Alex Manzara, please click here.

