

Now that the price of crude oil has traced a satisfactory five-wave pattern into support, we believe there may be opportunities for long trades during the next several months. Here we identify some upward target regions and some events that could indicate that the trend is changing.
In late 2013, crude oil futures moved out of a consolidating triangle (labeled as ‘B’) and began sliding downward in a powerful five-part wave ‘C’, reaching the main target area we had been watching. Although the decline was sharp, it also transpired in an orderly fashion, as shown by the way price recognized the boundaries of a channel anchored on small waves [i] and [ii].
Even though price fell faster and farther than most were expecting, wave [iii] found support at the bottom of the channel, and wave [iv] met resistance near the top. The best confirmation that the downward sequence is over will be a breakout from the channel, as drawn on the weekly chart below. Positive divergence on the CCI momentum indicator suggests the channel may be on the verge of breaking.
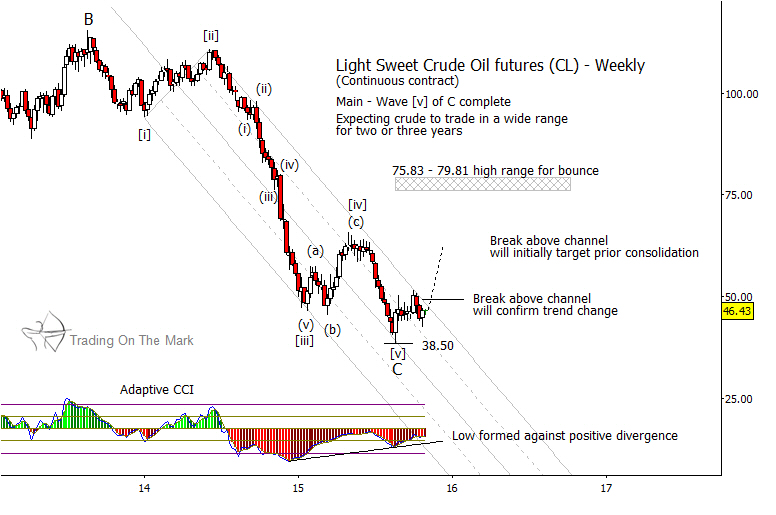
With a confirmed change in trend, it should be possible to fish for trade entries on pullbacks. However, it will be important to monitor exhaustion signals as an upward move progresses. As shown on the monthly chart we linked earlier, the next big-picture development in crude oil prices probably will take the form of a large upward/sideways correction that stays within a range. The most likely area for initial resistance (i.e., the first part of the pending corrective pattern) is near the price high of the earlier wave [iv] shown on the weekly chart. If the pattern goes on to form additional waves as expected, then price might eventually reach as high as the $75-$80 area after first making a higher low some months in the future.
If this type of analysis is helpful in your trading and investing, let us know that you’d like to receive an occasional newsletter. It offers big-picture analysis and perspectives delivered to your inbox every few weeks.

