By: Scott Redler
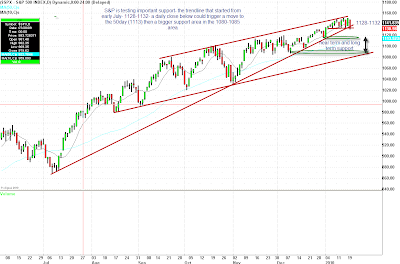
Take a look at a daily chart of the S&P going back to July. The trendline in place since the mid-July low has withstood several tests on the way up. Today and tomorrow collectively will provide an important tell as to whether that trendline can continue to hold. A daily close below 1,128-1,132 in the S&P could trigger a move to the 50-day moving average at 1,113, or to the larger support area in the 1,080-1,085 range.


