

We are short-term traders. We make our money by correctly identifying inflection points where the index futures – especially the S&P 500 mini futures (ES) – are likely to stop moving in one direction and reverse.
But every once in a while we stop and take a longer-term look at the stock indices. And when we look at the rest of this year and the beginning of next, we see a confirmed bull market that we thing will continue going up.
Sure, there will be short-term corrections along the way, and we will trade them when the opportunities arise. But the general direction of U.S. equity markets is up. This long-term chart of the S&P 500 index shows why.
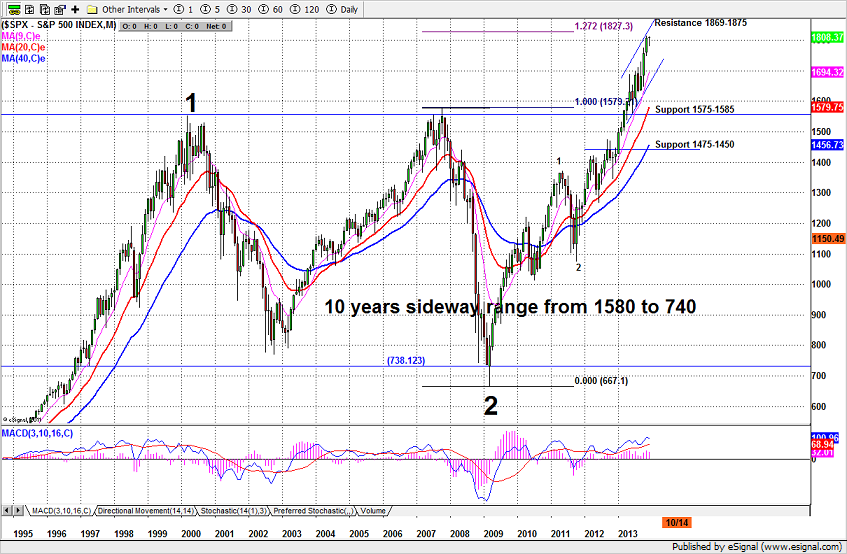
Chart: S&P 500 Index – Long-term chart
Even a casual glance at the charts shows that we have broken out from a 10-year range marked by two clear bottoms and two clear tops around the 1580 level, the first the top for the Dot-com bubble (2000) and the second the top of the sub-prime bundle (2007).
Thanks to massive intervention by the Federal Reserve, in the form of its trillion-dollar bond-buying program and zero interest-rate policy, we broke out of that range in March. Since then, momentum clearly favors the bulls.
BUT HOW LONG WILL IT LAST?
Our technical analysis methods use two elements – time and chart patterns – to help us calculate the third, the price. We use them to catch short-term swings, but they are also useful for the longer-term.
The markets don’t repeat themselves but they rhyme, and the movements tend to be symmetrical. It took about 4.5 years for the last bull market to complete, from the low in 2002 to the peak in 2007. If the current up-leg takes the same amount of time to complete the move that began in March, 2009, it will end sometime after the first quarter of 2014. We aren’t there yet.
CHART PATTERNS
There are two patterns we are looking at in this chart, the Elliott Wave count and the Double Bottom. Both are showing some room for the bull run to continue for a while.
Our Elliott Wave count gives us a start for impulse wave 3 – the sub-wave of Primary Wave 3 – around 1070 (the low in 2011). This combination – sub-wave 3 of Primary Wave 3 – is usually the longest and strongest, and we would expect it to extend significantly.
A 1.272 Fibonacci extension of Primary Wave 2 would put us about 1827. But it could easily move some distance beyond that level.
The second pattern is the breakout from the long-term range established by the 2007 top (around 1580). The breakout occurred last March. We have an initial breakout momentum target around 1800, plus or minus 1%.
We are there now, which means we can expect a small correction in the New Year, provided the Index (SPX) does not close above 1880. (If it does, it is likely to continue higher to the next momentum target. We have a final breakout pattern target around 2380-2500 but it will require more time to reach that level).
WHAT’S AHEAD IN 2014
The three major elements we look at – time, price and pattern – are giving us a near-term target for this rally around 1835 now and a target of 1880 – 2040 in the first six months of 2014.
But don’t expect it to go straight up. Sometime after the New Year we expect a correction from whatever high is made in the first quarter. We think the correction will be 120 (min) to 300 points.
This will be our last article in Trader Planet until after the New Year. We’d like to take this opportunity to wish all of our readers a safe holiday season, and a happy and prosperous New Year.
= = =
Learn more about Naturus, a subscription service for futures traders here.

