
By: Macro-Trader
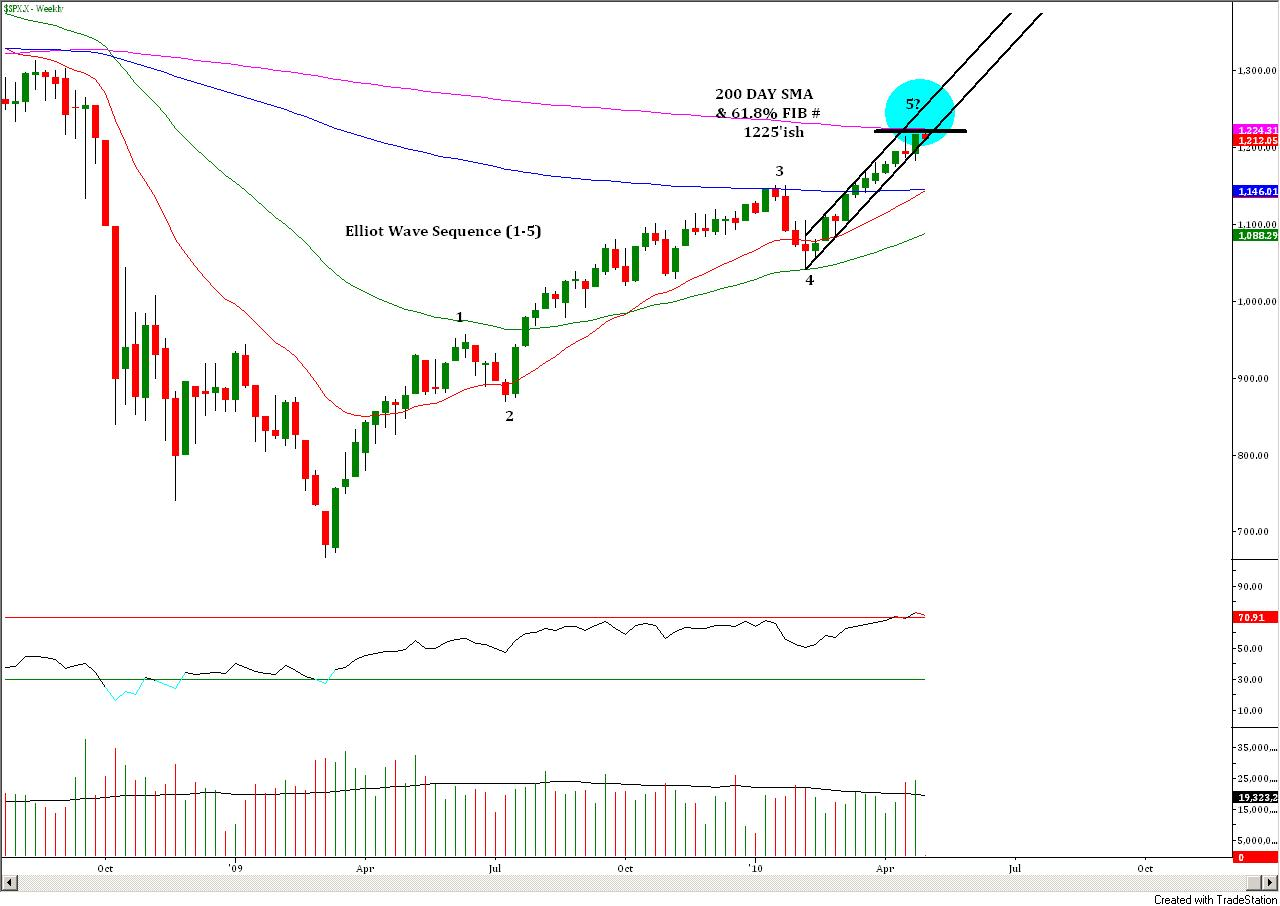
Last Thursday, I outlined a triangle pattern in the SPX which broke out to the upside heading into the weekend. This is an excerpt from Thursday’s posting – “In accordance with Elliot Wave theory, the high level nature of this formation has created a ‘4th wave triangle’. This means that should we break out we will be entering the final thrust of this up move before correcting.”
While the S&P was putting in a triangle so was the financial group (XLF), which accounts for nearly 17% of the S&P 500. However, when the broad market broke higher this already lagging sector continued to stay behind. Today, the underside trend-line of the triangle was broken putting not only financial names at risk but the whole market.
.png)
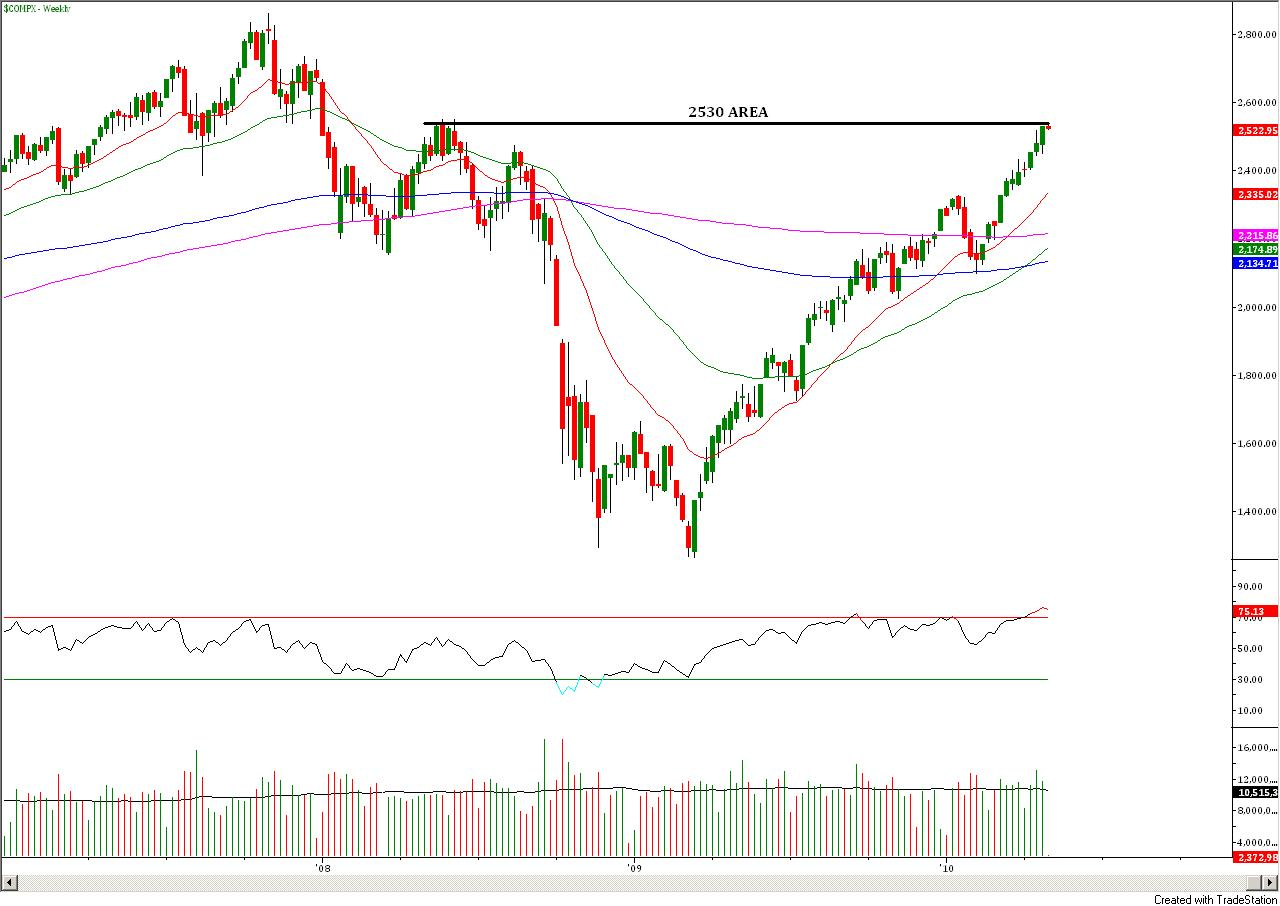
Both the S&P 500 and NASDAQ have run up into or near longer term resistance levels. 1225’ish and 2030’ish respectively. Many sentiment guides have become excessively bullish as well.
Case for cautiousness:
In the coming days, it will be important to pay attention to the degree of further weakness in the financial equities, should it occur, and how much it will affect the broader market. The FOMC meeting on Wednesday could shake things up as well.

