It´s very much same as my few weeks old chart for Gbp-Yen by pattern point of view.
Something gracy is preparing to come out from this also.
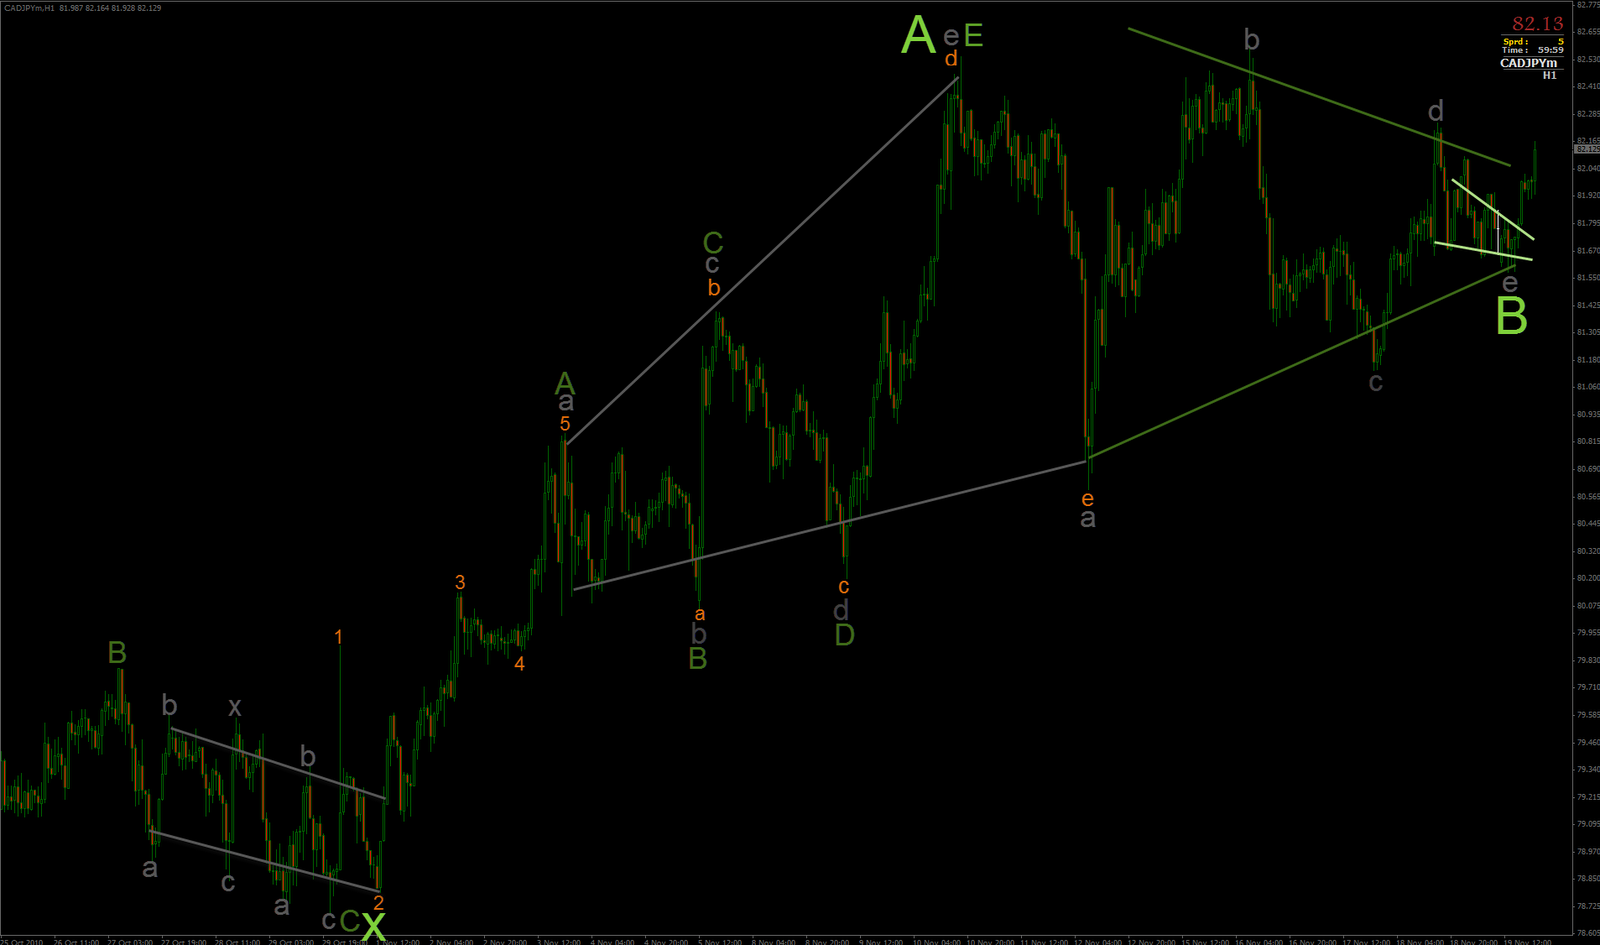
Also price behaviour is very much same as Gbp-Yen has had over the recent weeks with that hourly chart, how it trades these next patterns once these diagonals are ended.
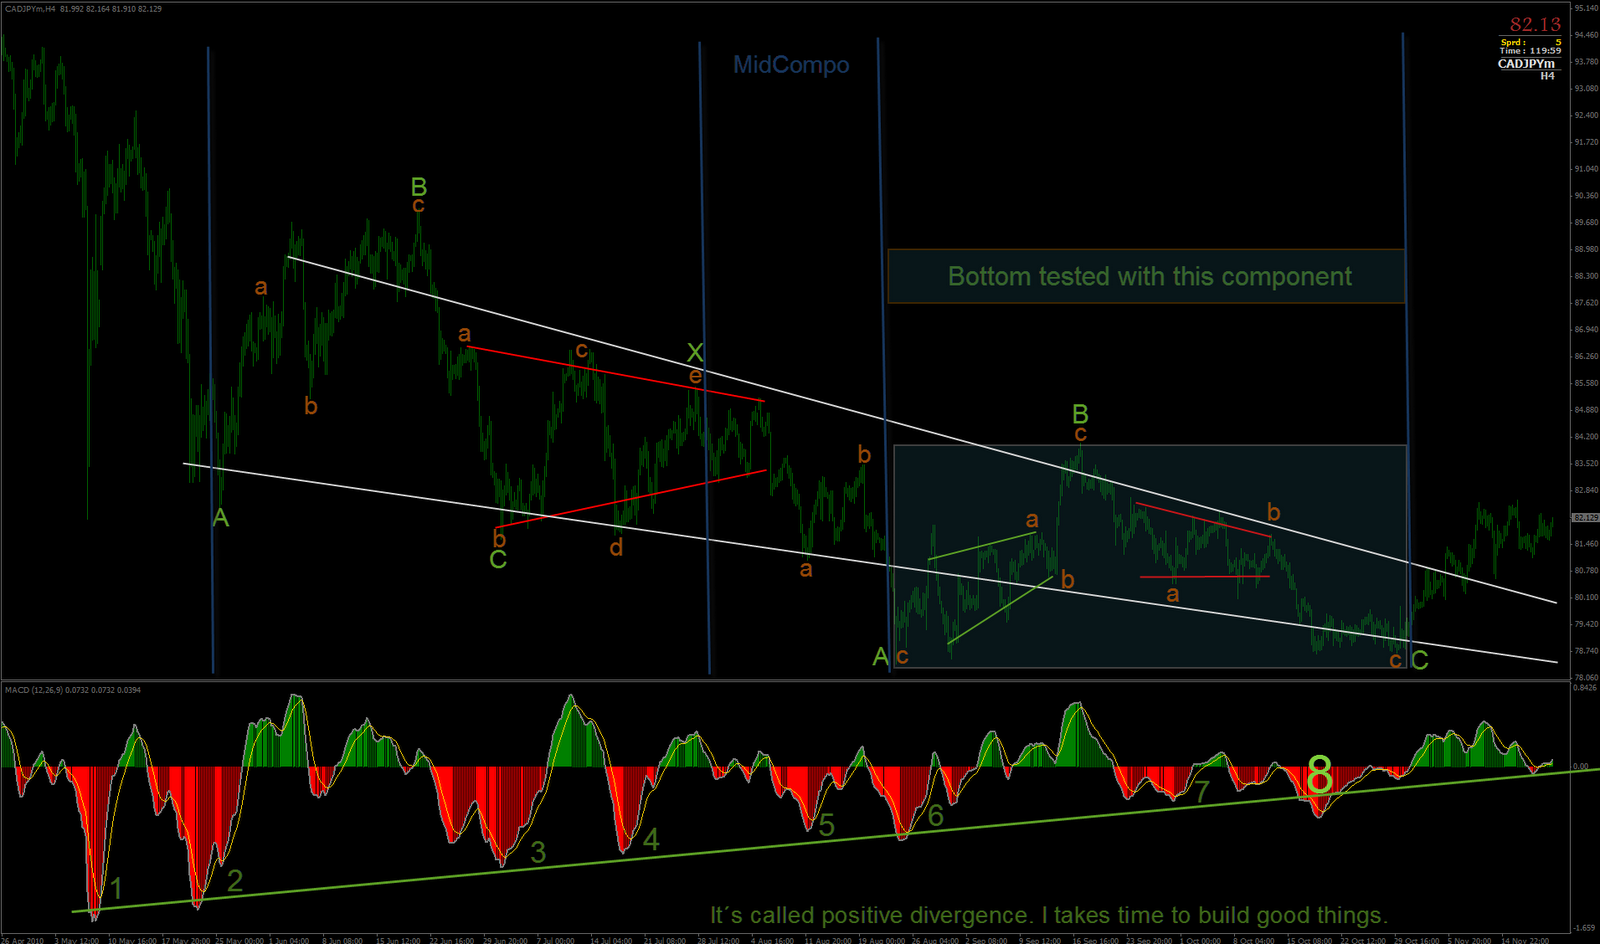
For instance those One2One´s are highly presented with these complex flat and zigzag “blow-offs” where it only marks change the waves itself. It is of cource 0.618%-0.707% retracement all the time from previous swing.
That last C was also triple complex flat as own pattern for it with hourly data. This abc-X-abc chart I posted some time ago is also taken from it chart but it is only that third component for it as own pattern. The pattern itself is far much bigger and more complex they are, more than likely they end very important things, response is not lazy for them or short lived either with time anymore. They really end things.
abc-X-abc-X-abc-X ended it with that last cottom c (not shows in these charts).
I expect this pricechart to trade the same way as GJ did and does, they are also complex zigzags how they trades out from these patterns. That means deep retracements, long, angry and rapid swings, which then cracks down again, retrace from previous one, start new one again and again, but the end result is the prices are rising all the time.
Completely different world as any EurUsd or SPX is with EW. Diagonal business.