
The S&P 500 cash index (SPX) closed at 1354.68 on Friday, down 7.48 points for a net weekly loss of 0.5 %.
Last Friday the ECB cut its interest rate to 0.75% from 1% and the BOE kept interest rates unchanged but provided an extra ?50 billion for asset purchases in its quantitative easing program. At the same time, the Chinese joined the rate cut party by lowering their interest rate and reducing bank reserve rates.
But the optimism generated by the EU summit Monday was erased quickly as details of the latest ‘solution’ leaked out. Instead concerns about the slow economy returned back the market. Friday’s jobless report was much worse than the first quarter and the market sold off on Friday. Only a last-hour ramp-up mitigated the damage.
This week is the beginning of the first quarter earning season, starting with Alcoa (AA) on Monday. The low expectations for earning could help the bulls. But external news may still prevent the price from rallying.
S&P500 Weekly Chart (SPX)
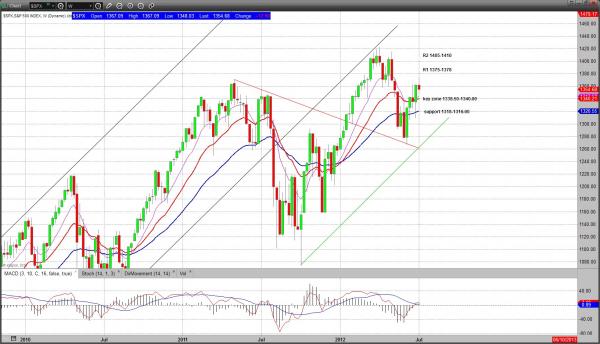
Technical analysis
Based on the weekly chart (above), the key zone 1338.50-1340 remains the current support level. On Friday SPX managed to close above 1342, which indicates that the intermediate-term bullish signal is still valid. In the early week we may see a further pullback down to 1340 area. As long as 1340 holds, the price could bounce back up again. But the bounce may not take us very far.
Based on Wave principles, $SPX is at crossing line area and must make a decision for its next move. A move above 1375 confirms that wave 5 is in process, with the first high target around 1410 or less – perhaps lower to 1400-1395. A failure to breakout from the 1375 level, but instead a break-down through 1320 indicates that wave 4 is not complete yet, and a further decline to 1280-1275 should be expected.
Monthly resistance 1400 and support 1290; Weekly resistance 1385 and support 1320
To see more details of the Naturus free weekly market outlook, including gold, oil, bonds and the Euro, visit www.naturus.com. Free registration required.

