
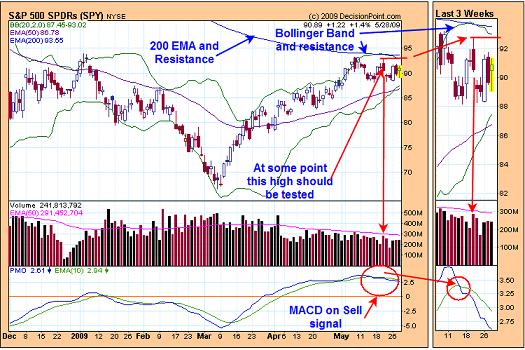
It appears in Intermediate term that the market is building a top and we are short the SPX at 883.82. Usually high volume highs are re-tested and if the re-test comes on lighter it would generate a bearish signal. On 5/20 a high volume high occurred and we are looking for a test of that high. If the test comes on lighter volume and close below the 5/20 high (high on 5/20 came in at 92.80) then that may be a good place to add to short positions. The bottom window shows that the MACD is on a sell signal. For resistance, the 200 day moving average comes in near 94 and is a resistance level and the Bollinger Bands come in near 93 and is also a resistance level. Therefore it appears the market has little upside from here.
We Bought ASTM at 1.92, Biotech group. Long POWR at 13.70 on 12/14/07.
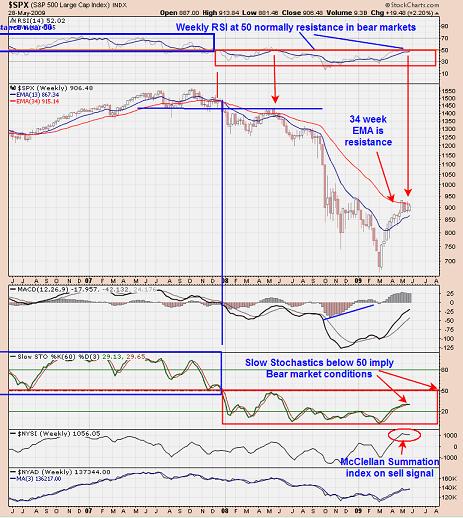
Above is the weekly SPX. The top window shows the Weekly RSI. In bear markets the Weekly RSI usually shows resistance near the 50 range. Notice that RSI is in the 50 range now. On the SPX chart, the red trend line is the 34 week moving average. In bear markets the 34 week MA is a resistance point and the SPX is in that range now. The second window from the bottom is the weekly NYSE McClellan Summation index and it has turned down which implies the SPX has turned down. The third window from the bottom is the weekly Slow Stochastics. Bear market conditions are present when Slow Stochastics is below 50 and current Slow Stochastics is below 50. Near term the SPX could attempt a re-test of the recent highs but with the Weekly RSI near 50, the 34 week MA showing resistance and the Weekly Slow Stochastics below 50 then the recent high should stop the rally. We are looking for a pull back into the July 4 timeframe that could approach the 74 range on the SPY.
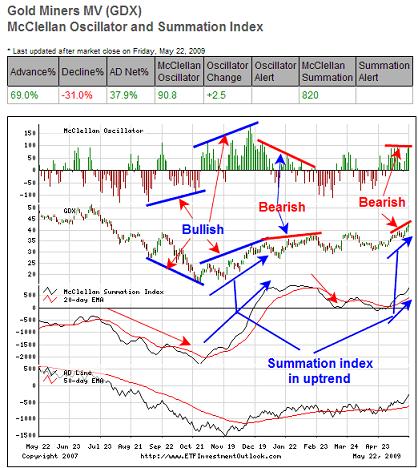
RSI for GDX closed over 70 for the last couple of day and in the past have lead to pull backs. Also GDX is up against trend line resistance the same time RSI is at 70, which suggest the trend line has resistance and my hold GDX back. On Balance Volume took a big jump the last few days and previously when surges of this magnitude has occurred the market consolidated for several weeks. The above chart is the McClellan Summation index for GDX (courtesy of www.ETFinvestmentoutlook.com). When the Summation index is rising then gold stocks are in an uptrend and vice versa. Right now the Summation index is rising. Over the last week or so, GDX has made higher highs and the Summation index is showing a divergence. However as long as the Summation index trends higher then we have to say the uptrend in GDX is enforce. Our view is that the uptrend may not last much longer and a consolidation could start at any time that may last several weeks. Long GLD at 89 on 4/24/09. Long KRY at 1.82 on 2/5/08. We are long PLM at 2.77 on 1/22/08. Holding CDE (average long at 2.77 (doubled our position on 9/12/08 at 1.46, Sold 5/13/09 at 1.55=6% gain). Bought NXG at 3.26 on 6/4/07. We doubled our positions in KGC on (7/30/04) at 5.26 and we now have an average price at 6.07. Long NXG average of 2.26. For examples in how “Ord-Volume” works, visit www.ord-oracle.com.

