
![]()
Affirm Holdings Inc. ($AFRM) is a financial services company founded in 2012 by Max Levchin, Nathan Gettings, and Jeff Kaditz. The company provides point-of-sale financing options for online shoppers. In 2020, Affirm Holdings Inc. reported $1.2 billion in revenue and had 1,500 employees. In 2021 the company matched its 2021 revenue and is forecasted to grow by 29% this coming year.
The company’s business model relies on partnerships with merchants to offer financing at the point of sale. Affirm also uses data from these transactions to assess the risk of each loan and set interest rates accordingly. Overall, Affirm seems to be a well-run company with a solid business model. However, as with any stock, there are risks considering before investing. For example, the company’s reliance on partnerships could make it difficult to scale up in the future. Additionally, the high interest rates on some of its loans could lead to default risk if borrowers are unable to make their payments. Nevertheless, Affirm Holdings Inc. ($AFRM) is worth considering as a potential investment.
Point of sale financing, also known as merchant financing, is a type of short-term loan that is provided by a merchant to a customer at the time of purchase. The merchant agrees to pay the lender back over time, with interest, and the customer pays the merchant back according to the terms of the loan. merchant financing can be a wonderful way for merchants to offer their customers financing options without taking on all the risk themselves.
There are a few diverse ways that merchants can offer point of sale financing to their customers. The first is by partnering with a lender, such as a bank or credit union. The merchant agrees to refer their customers to the lender for financing, and the lender provides the funding and manages the loan. The second way is for the merchant to finance the loans themselves. In this case, the merchant would be responsible for funding the loans and managing them.
The cost of point-of-sale financing varies depending on the merchant, but it is typically based on the amount of the purchase, the length of time it takes for the customer to repay the loan, and the default risk of the customer. Default risk is higher for customers with lower credit scores or who have a history of past due payments. competitors also play a role in setting prices; if there are many competitors offering equivalent products, prices will be lower. Ultimately, merchants need to weigh chargebacks against ‘lumpy’ sales when making pricing decisions.
The company is currently unprofitable and is not forecasted to become profitable over the next 3 years. Another troubling aspect about the companies’ financials is that $AFRM is diluting its stock. When a company dilutes its stock, it means that the company is issuing new shares of stock. This can happen through a variety of means, such as a stock split or secondary offering. When dilution occurs, the value of each existing share of stock is reduced. In addition, dilution can have an impact on shareholder equity and executive compensation. dilution can also affect earnings per share (EPS). As more shares are outstanding, each share represents a smaller portion of the company’s overall earnings. As a result, EPS is usually lower when a company dilutes its stock. While dilution has some negative effects, it can also be used to raise capital for a company. When done properly, dilution can help a company to grow and expand its business.
In this weekly stock study, we will look at and analyze the following indicators and metrics as are our guidelines which dictate our behavior in deciding whether to buy, sell, or stand aside on a particular stock.
- Wall Street Analysts’ Estimates
- 52-week high and low boundaries
- Best Case – Worst Case Analysis
- Vantagepoint A.I. Forecast (Predictive Blue Line)
- Neural Network Forecast
- Daily Range Forecast
- Intermarket Analysis
- Our trading suggestion
We don’t base our decisions on things like earnings or fundamental cash flow valuations. However, we do look at them to better understand the financial landscape that a company is operating under.
Analysts Ratings
The first set of boundaries which we explore in our stock study is what do the professionals think who monitor the stock for a living. We can acquire this information by simply looking at the boundaries that the top Wall Street Analysts set for $AFRM. This initial set of boundaries provides us with an idea of what is expensive, fairly valued, and cheap.
Based on 10 Best Performing Wall Street analysts offering 12-month price targets for Affirm Holdings in the last 3 months. The average price target is $40.00 with a high forecast of $80.00 and a low forecast of $15.00. The average price target represents a 22.77% change from the last price of $32.58.
52-week High-Low Chart
Where the rubber meets the road as far as analysis is concerned is looking at the charts and evaluating where the asset stands in relation to its 52-week highs. As counterintuitive as it may sound, great stocks tend to consistently make new 52-week highs.
One of the simplest ways to evaluate a stock is to look at some long-term monthly and weekly charts to be able to zoom out and see the big picture of the trend. Some of the greatest traders in the world use longer-term monthly charts to determine trend analysis.
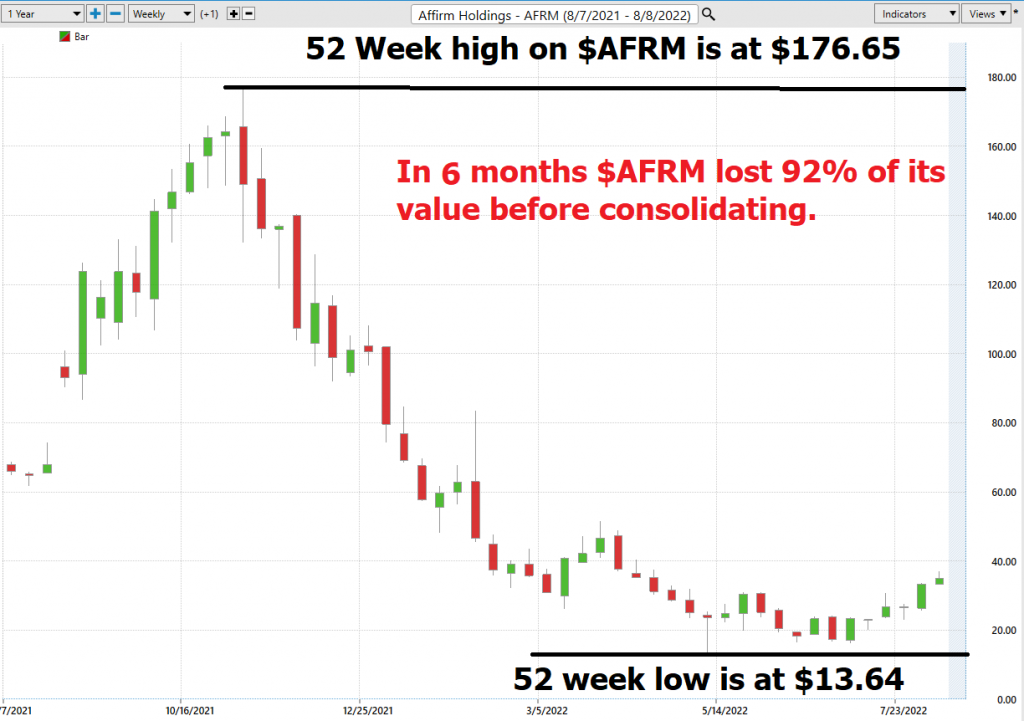
Over the last 52 weeks $AFRM has traded as high as 176.65 and as low as $13.64. This is an incredibly wide trading range making this one of the most volatile stocks we have ever analyzed. More importantly in a 6-month time frame the stock lost 92% of its value. Coincidentally the selloff began exactly when the Federal Reserve started discussing the possibility of raising interest rates.
We always pay attention to where we are in relation to the 52-week trading range. $AFRM is currently trading at its 14th percentile on the annual 52-week chart.
The most treacherous market to try to trade from the long side is a market that is consistently making new lower lows. Over the past 16 weeks $AFRM has staged a 150% rally off of its lows. While this grab headlines the price action clearly indicates that $AFRM is not out of the woods yet.
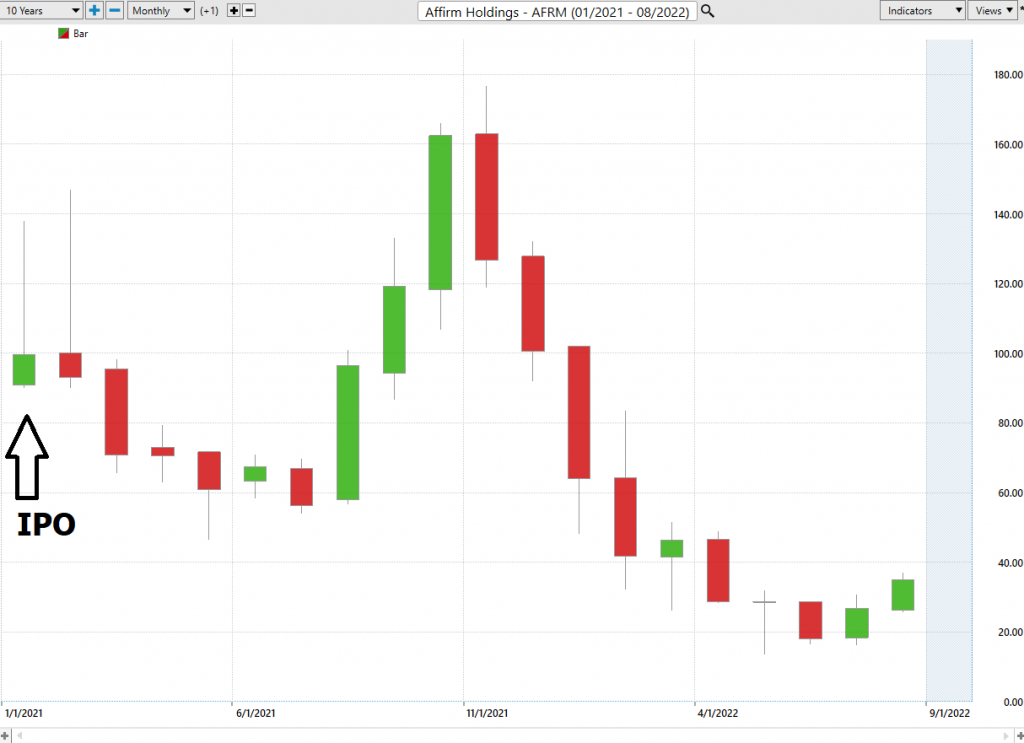
On November 18, 2020, Affirm filed with the Securities and Exchange Commission in preparation for an initial public offering (IPO). On December 12, 2020, it was reported that Affirm had postponed its IPO. On January 13, 2021, Affirm became listed on NASDAQ with symbol AFRM, raising about $1.2 billion in its IPO. When we zoom out on the stock, we only see a few more months of price action. Nonetheless, the company has lost 64% of the market capitalization it had on the day it went public.
Best Case – Worst Case Analysis
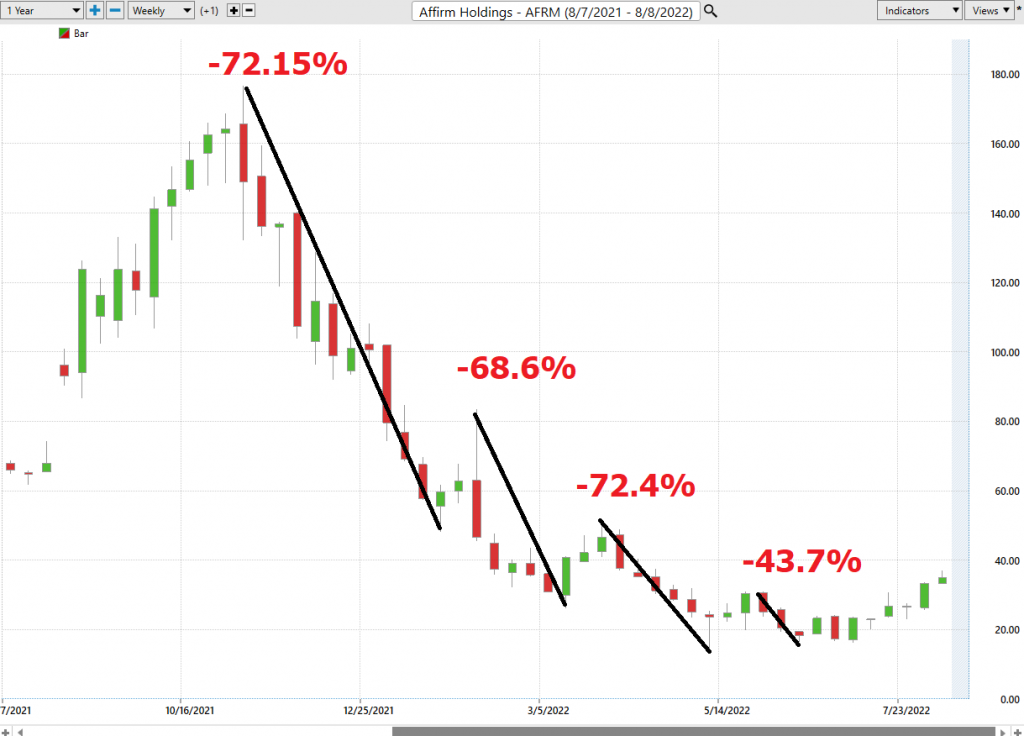
We then like to look at how the market rallied and declined over the past year to determine a perspective on real volatility for $AFRM. To do this we simply measure bottom to top rallies that had no lower lows, and peak to bottom declines that had no higher highs. This allows us to quickly see what the best case and worst case of market conditions looked like and provides a very realistic set of expectations moving forward.
Here is the worst-case analysis:
Followed by the best-case analysis:
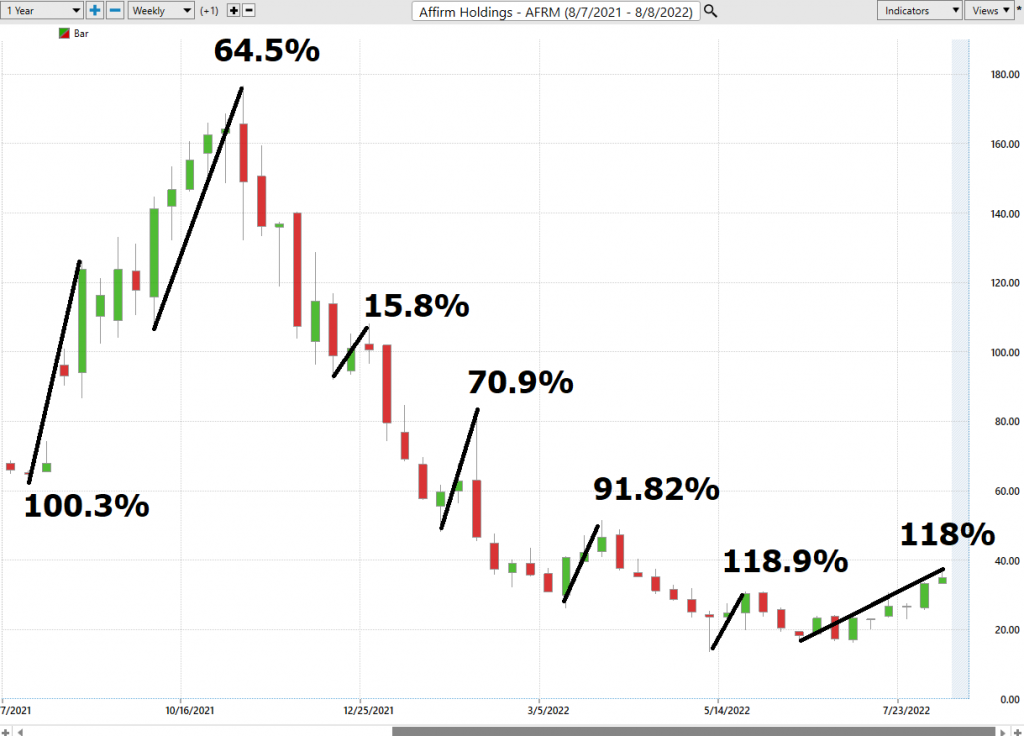
When you evaluate these rallies and declines the only conclusion you can draw is that $AFRM is one of the most volatile assets on the exchanges.
AFRM is more volatile than 90% of US stocks over the past 3 months, typically moving +/- 22% a week.
Next, we want to evaluate $AFRM is in comparison to the performance of the major stock market indexes which we have greater familiarity with and then look at the drawdowns of the stock over the past year to get a worst-case scenario idea for any conclusions that we might reach when we trade this asset.
- Over the past year $AFRM is DOWN 44.3%.
- The Dow Jones Industrials are down 5.6% over the past year.
- S&P 500 is down 5.5% over the last year.
- Russell 1000 Small Cap is down 7.57 % in the past year.
- The NASDAQ is down 1.16%
You can see $AFRM performed substantially worse than the broader market indexes even with the recent rally.
We would expect this type of volatility to continue. This means that massive drawdowns peak to trough should be considered very normal moving forward.
Vantagepoint A.I. Forecast (Predictive Blue Line)
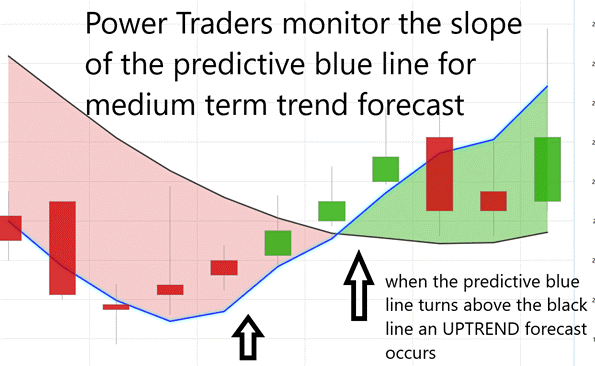
Using VantagePoint Software and the artificial intelligence, traders are alerted to trend forecasts by monitoring the slope of the predictive blue line. The black line is a simple 10 day moving average of price which simply tells you what has occurred in the market. The predictive blue line also acts as value zone where in uptrends traders try to purchase the asset at or below the blue line.
In studying the chart below, pay close attention to the relationship between the black line and predictive blue line. All that the black line tells you is what has occurred. It tells you where prices have been and what the average price over the last ten days is.
The predictive blue line, on the other hand utilizes that Vantagepoint patented Neural Network and Intermarket Analysis to arrive at its value. It looks at the strongest price drivers of an asset through artificial intelligence and statistical correlations to determine its value.
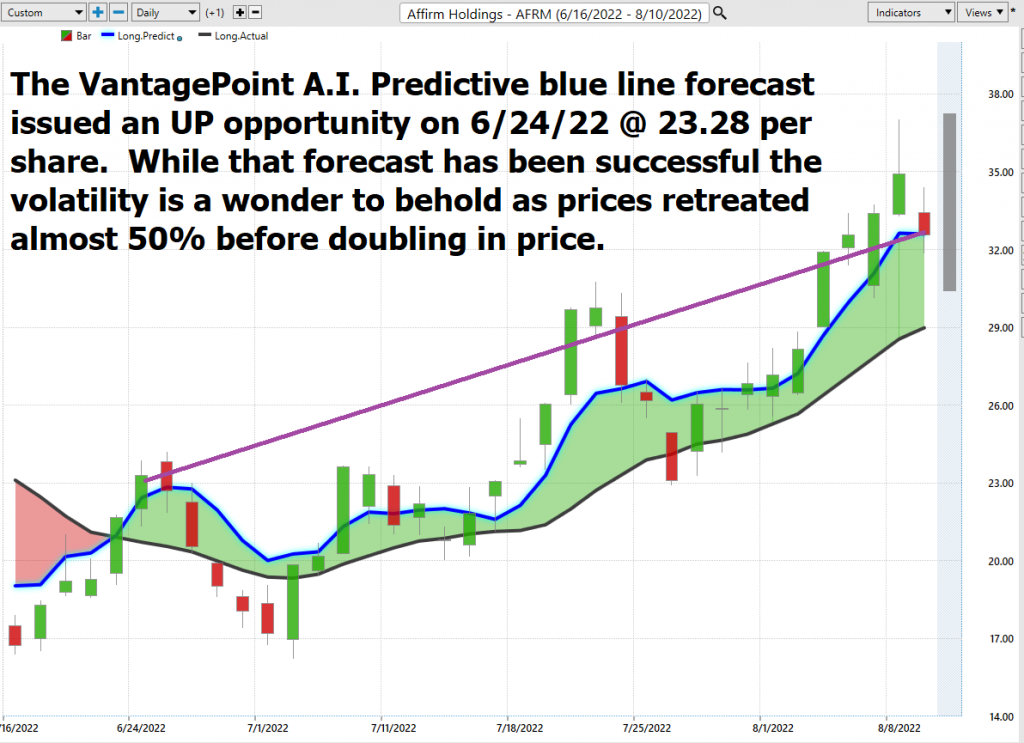
Whenever we see the predictive blue line move above the black line, we are presented with an UP-forecast entry opportunity. These are highlighted by UP arrows on the chart.
Whenever the predictive blue line moves below the black line, we are presented with a DOWN forecast. More importantly, there is no guesswork involved. Traders always know where the value zone and trend are.
Fine Tuning Entries with The Neural Net Indicator
At the bottom of the chart is the Neural Network Indicator which predicts future strength and/or weakness in the market. When the Neural Net Indicator is green it communicates strength. When the Neural Net is red it’s forecasting short term weakness in the market.
We advocate that Power Traders cross reference the chart with the predictive blue line and neural network indicator to create optimal entry and exit points.
A Neural Net is a computational learning system that uses a network of functions to understand and translate massive amounts of data into a desired output, consistently monitoring itself and improving its performance.
Power Traders are always looking to apply both the neural network and A.I. to the markets to find statistically sound trading opportunities. We refer to this as a “double confirmation” setup and look for the predictive blue line to slope higher and to be confirmed by the Neural Net at the bottom of the chart. In the world of technical analysis, trend confirmation refers to the verification of momentum in each market trend. This is typically done using statistical techniques. While trend confirmation does not guarantee success, it does provide traders with important quantitative probabilities that can help to improve their chances of making profitable trades. For this reason, trend confirmation is an essential tool for any technical trader. By double confirming trends, traders can minimize their risk and maximized their chances of success. By requiring two different indicators to line up, traders are effectively increasing the quantitative probabilities that their trade will be successful. While it is by no means foolproof, double confirmation will reduce risk and improve the chances of success for technical analysis traders.
The arrows on the following chart isolate all of the occurrences when a double confirmation signal occurred.
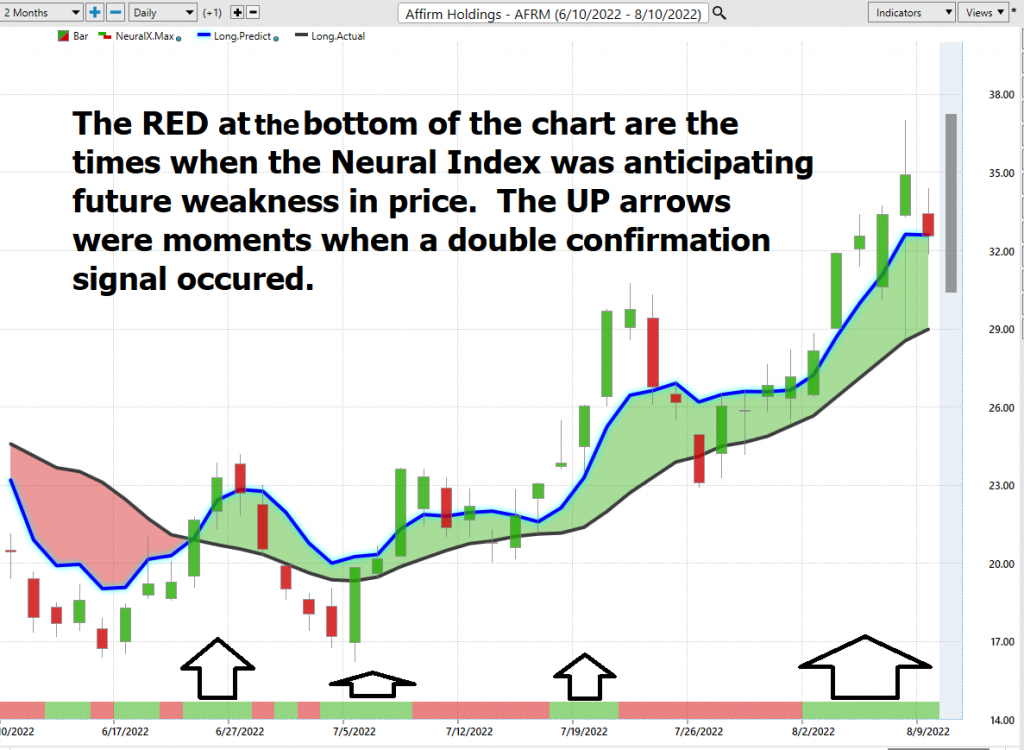
We advise Power Traders to cross reference the predictive blue line with the Neural Net for the best entry opportunities. Observe how the slope of the predictive blue line has remained positive from the time earnings were announced.
You can see in the chart above how the Neural Net offered several opportunities of double confirmation to Power Traders, when the predictive blue line and the Neural Net aligned with the same forecast. These instances provide extremely high probability trading opportunities to exploit the trend.
VantagePoint Software Daily Price Range Prediction
One of the powerful features in the Vantagepoint A.I. Software which Power Traders use daily is the Daily Price Range prediction forecast.
This forecast is what permits Power Traders to truly fine tune their entries and exits into the market. As we have discussed, $AFRM is more volatile than 90% of stocks that are traded with an average weekly range of 22%. Over the past year the maximum daily trading range on $AFRM was 57.2% range in one day. The average trading range over the entire year has been 9.8%. In spite of these huge volatile swings the Vantagepoint A.I. daily range forecast provides traders with exacting precision as to where to buy and sell.
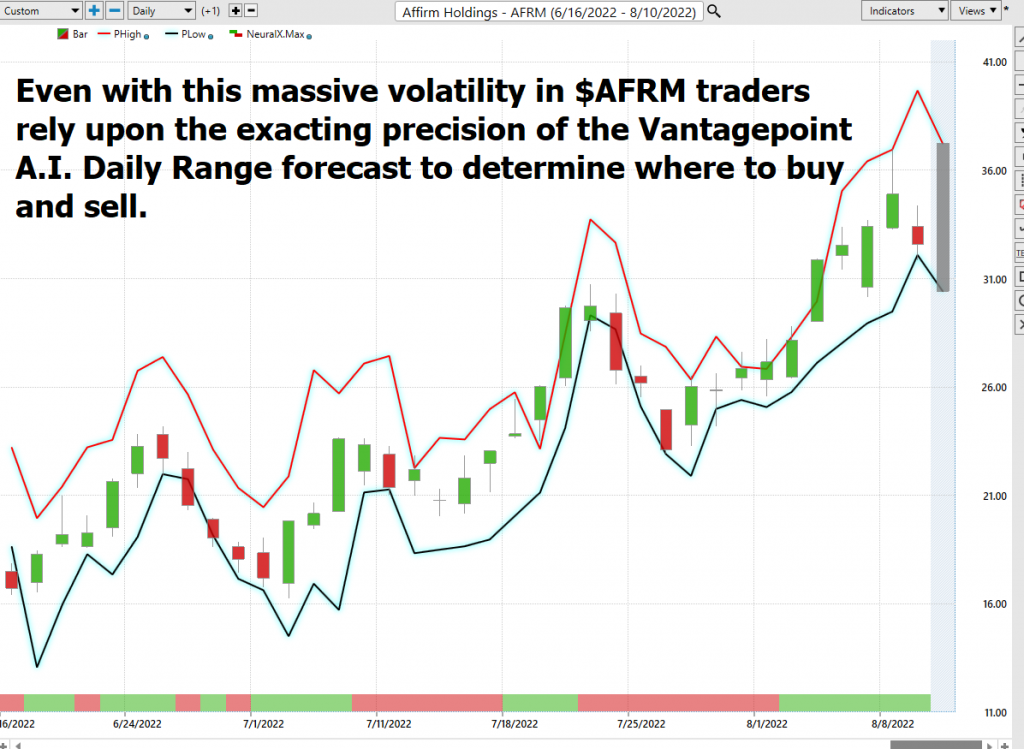
What is the most important feature that traders are concerned about? Traders need to know where to enter and exit a market. VantagePoint provides this answer with exacting precision. Every day the Daily Range forecast is updated to provide insight to anticipated price action.
Intermarket Analysis
What makes the Vantagepoint Software extraordinary is its capacity to perform Intermarket analysis and to find those assets which are most statistically interconnected and are the key drivers of price.
Studying the charts can always provide objective realities in terms of locating support and resistance levels which become noticeably clear on a chart. But we live in a global marketplace. Everything is interconnected. The billion-dollar question for traders is always what are the key drivers of price for the underlying asset that I am trading?
These intangibles are invisible to the naked eye yet show extremely high statistical correlations.
Small changes in Interest rates, Crude Oil Prices, and the Volatility of the dollar amongst thousands of other variables affect the decisions companies must make to survive in these challenging times. Trying to determine what these factors are is one of the huge problems facing investors and traders.
Statistical correlation is a measure of the relationship between two variables. Traders use correlation analysis to evaluate assets that have historically moved together to predict future performance. It’s important to remember that correlation is not causation, however, intermarket analysis is often used by hedge funds in conjunction with other quantitative methods, such as regression analysis to determine risk and reward scenarios. By considering multiple relationships, trend probabilities can be estimated with greater accuracy. This type of analysis can be helpful for identifying opportunities and managing risk.
While correlation does not guarantee anything, it is useful tool for traders who are trying to make informed decisions about where to allocate their capital. By understanding how different assets have moved in relation to one another, traders can make predictions about which assets are more likely to move in a certain direction in the future. This type of analysis can give traders an edge in the market by helping them to identify potential opportunities and manage risk more effectively.
There is excellent value to be had in studying and understanding the key drivers of $AFRM’s price action.
By doing so you can often see which ETFs are most likely acquiring $AFRM as well as uncovering other industries which affect $AFRM price movement.
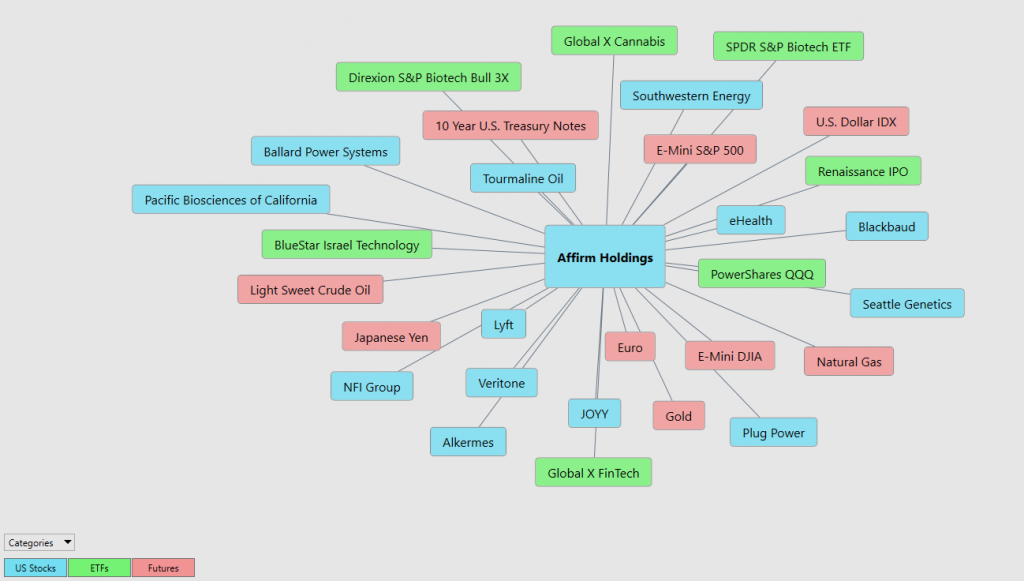
This can be invaluable information because it allows a trader to locate other opportunities and see a listing of the ETF’s that are also buyers of $AFRM. This knowledge is how other trading opportunities are often uncovered in their embryonic stages.
Suggestions
The trend is UP. Wall Street thinks $AFRM is undervalued by a large amount. But on the flip side the stock has suffered greatly since the Fed started discussing raising interest rates. Apparently, the Point-of-Sale financing model used by $AFRM charges extremely high rates to buyers for the ability to spread payments out over a longer term.
We think this asset is worth watching and paying attention to their future earnings. The next earnings date for $AFRM is August 25, 2022, and that will certainly be the catalyst for future price action.
Whenever we see a stock that is trading 60% plus below its IPO price, we urge extreme caution. The recent rally in $AFRM is impressive from a percentage basis. But there is a very good chance that this massive rally was also just short covering.
The predictive blue line is the guidance that we will be following. Wall Street Analysts are slowly revising their estimates upward. I think the best probabilities are to stand aside.
The chart looks very volatile. This is very tradeable by seasoned traders. But it requires an iron constitution and exceptional money management skills.
We will re-evaluate this analysis based upon:
- Wall Street Analysts’ Estimates
- 52-week high and low boundaries
- Vantagepoint A.I. Forecast (Predictive Blue Line)
- Neural Network Forecast
- Daily Range Forecast
- Intermarket Analysis
Let’s Be Careful Out There!
Remember, It’s Not Magic.
It’s Machine Learning.

IMPORTANT NOTICE!
THERE IS SUBSTANTIAL RISK OF LOSS ASSOCIATED WITH TRADING. ONLY RISK CAPITAL SHOULD BE USED TO TRADE. TRADING STOCKS, FUTURES, OPTIONS, FOREX, AND ETFs IS NOT SUITABLE FOR EVERYONE.
DISCLAIMER: STOCKS, FUTURES, OPTIONS, ETFs AND CURRENCY TRADING ALL HAVE LARGE POTENTIAL REWARDS, BUT THEY ALSO HAVE LARGE POTENTIAL RISK. YOU MUST BE AWARE OF THE RISKS AND BE WILLING TO ACCEPT THEM IN ORDER TO INVEST IN THESE MARKETS. DON’T TRADE WITH MONEY YOU CAN’T AFFORD TO LOSE. THIS ARTICLE AND WEBSITE IS NEITHER A SOLICITATION NOR AN OFFER TO BUY/SELL FUTURES, OPTIONS, STOCKS, OR CURRENCIES. NO REPRESENTATION IS BEING MADE THAT ANY ACCOUNT WILL OR IS LIKELY TO ACHIEVE PROFITS OR LOSSES SIMILAR TO THOSE DISCUSSED ON THIS ARTICLE OR WEBSITE. THE PAST PERFORMANCE OF ANY TRADING SYSTEM OR METHODOLOGY IS NOT NECESSARILY INDICATIVE OF FUTURE RESULTS. CFTC RULE 4.41 – HYPOTHETICAL OR SIMULATED PERFORMANCE RESULTS HAVE CERTAIN LIMITATIONS. UNLIKE AN ACTUAL PERFORMANCE RECORD, SIMULATED RESULTS DO NOT REPRESENT ACTUAL TRADING. ALSO, SINCE THE TRADES HAVE NOT BEEN EXECUTED, THE RESULTS MAY HAVE UNDER-OR-OVER COMPENSATED FOR THE IMPACT, IF ANY, OF CERTAIN MARKET FACTORS, SUCH AS LACK OF LIQUIDITY. SIMULATED TRADING PROGRAMS IN GENERAL ARE ALSO SUBJECT TO THE FACT THAT THEY ARE DESIGNED WITH THE BENEFIT OF HINDSIGHT. NO REPRESENTATION IS BEING MADE THAT ANY ACCOUNT WILL OR IS LIKELY TO ACHIEVE PROFIT OR LOSSES SIMILAR TO THOSE SHOWN.

