
![]()
Apple has become the modern bellwether stock of the modern tech economy. Twenty years ago, companies like Exxon Mobil dominated headlines because of their influence in resources. Likewise, as the computer was coming of age, IBM was considered the premiere bellwether.
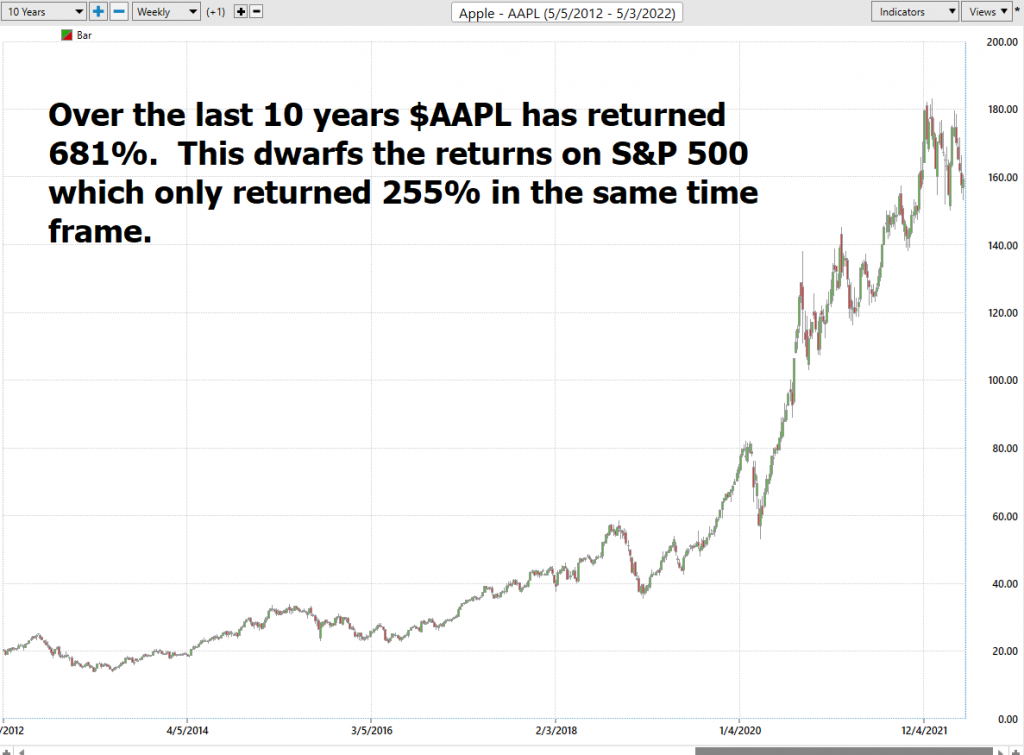
All you have to do is look at a 10-year stock of $APPL and you quickly appreciate how powerful its trend has been.
Even at its current price, investors are paying 7 times revenue and 27.5 times earnings to own Apple stock.
Rumors abound that soon Apple will be launching a 5g modem. The company has also successfully recruited former top brass from Ford. This increases the speculation that $AAPL is serious about launching an electronic vehicle in the next few years.
Apple’s flagship product is the iPhone which accounted for about 50% of the company’s revenue. The iPhone dominates the global market with roughly a 23.4% adoption rate. Samsung is in second with a 19% share.
Apple earnings are forecasted to grow by 3.8% per year. Over the last 5 years earnings have grown 15%. While the tech sector is crashing $AAPL has not. This is drawing investors, traders and analysts to take a second look.
The Apple Worldwide Developer Conference (WWDC) is set to occur on June 6th and has the industry very excited to learn about Apple’s new products and innovations. At the top of the list is SWIFT which is Apples proprietary software. The expectations are that the software will be enabled with new API’s allowing developers to increase functionality of the iPad and iPhone apps and software even on Windows platforms.
$AAPL has a market cap of $2.58 trillion.
In this weekly stock study, we will look at and analyze the following indicators and metrics as are our guidelines which dictate our behavior in deciding whether to buy, sell, or stand aside on a particular stock.
- Wall Street Analysts’ Estimates
- 52-week high and low boundaries
- Best Case – Worst Case Analysis
- Vantagepoint A.I. Forecast (Predictive Blue Line)
- Neural Network Forecast
- Daily Range Forecast
- Intermarket Analysis
- Our Suggestion
We don’t base our decisions on things like earnings or fundamental cash flow valuations. However, we do look at them to better understand the financial landscape that a company is operating under.
Analysts Ratings
The first set of boundaries which we explore in our stock study is what do the professionals think who monitor the stock for a living. We can acquire this information by simply looking at the boundaries that the top Wall Street Analysts set for $AAPL. This initial set of boundaries provides us with an idea of what is expensive, fairly valued, and cheap.
Based on 26 Wall Street analysts offering 12-month price targets for Apple in the last 3 months. The average price target is $191.04 with a high forecast of $215.00 and a low forecast of $161.00. The average price target represents a 19.22% change from the last price of $160.24.
From this simple analysis we can see that $AAPL is undervalued at present time but some on Wall Street think that is has the potential to run up to 20% higher.
52-week High-Low Chart
Where the rubber meets the road as far as analysis is concerned is looking at the charts and evaluating where the asset stands in relation to its 52-week highs. As counterintuitive as it may sound, great stocks tend to consistently make new 52-week highs.
One of the simplest ways to evaluate a stock is to look at some long term monthly and weekly charts to be able to zoom out and see the big picture of the trend. Some of the greatest traders in the world use the longer-term monthly charts to determine trend analysis.
Whenever we trade, we always pay attention to where we are in relation to the 52-week trading range. It is quite common to see the 52-week high provide very strong resistance to the market until it is breached. Often when the 52-week high is breached we will see the stock price explode higher very quickly over a short period.
The 52-week boundary often acts as significant resistance in thwarting trends. As price bounces off this level, we want to become extremely focused on what the artificial intelligence forecast is signaling.
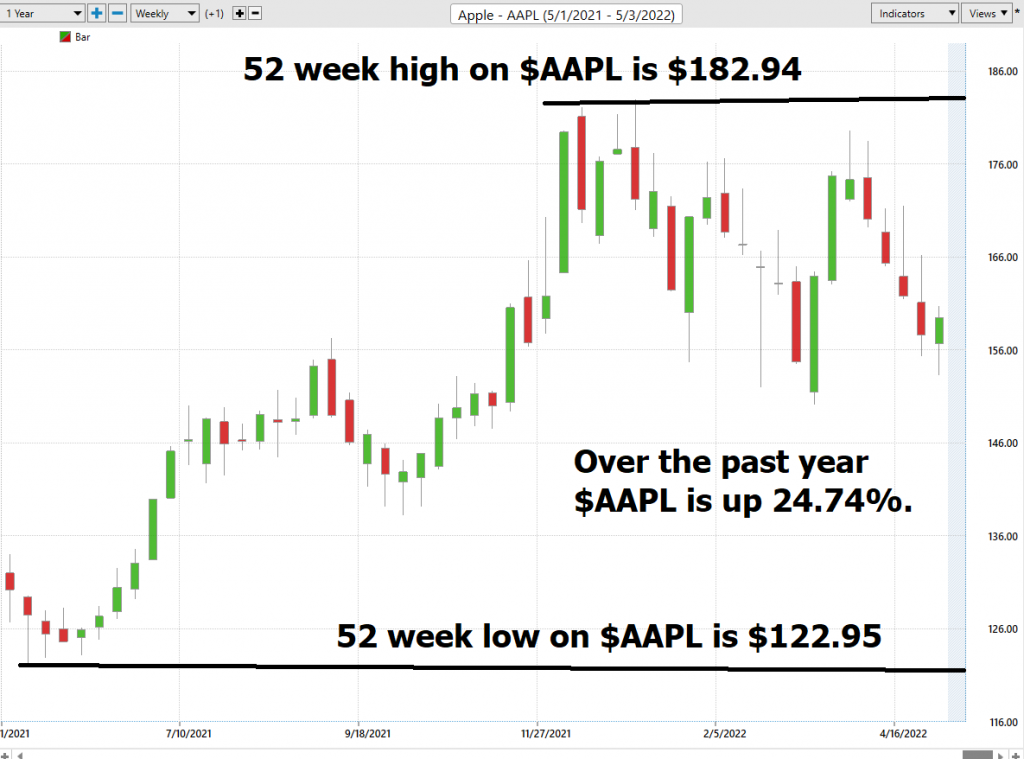
$AAPL has traded as high as $182.94 and as low as $122.95 over the last 52 weeks. Its annual trading range has been $60.59 which means that its average weekly trading range has been 1.17.
We also like to take the annual trading range of $60.59 and divide by the current price of $159.48 to calculate a broad-based measure of volatility. This tells us that the current volatility is 38.1%.
Using the annualized volatility, we can effectively project that the 12-month high forecast would be $220.17 and the 12-month low forecast would be $98.17. The price staying between these broad boundaries over the next year is what would be considered normal based upon the current volatility that $AAPL is displaying.
Remain acutely aware of the annualized volatility number particularly if you are a longer-term investor. You will often see drawdowns equivalent to one half to up to two thirds of the annualized volatility number in assets.
Based upon its recent drawdown $AAPL stock is trading at its 61st percentile based upon its annual range.
Best Case – Worst Case Analysis
Next, we want to evaluate $AAPL in comparison to the performance of the major stock market indexes which we have greater familiarity with and then look at the drawdowns of the stock over the past year to get a worst-case scenario idea for any conclusions that we might reach when we trade this asset.
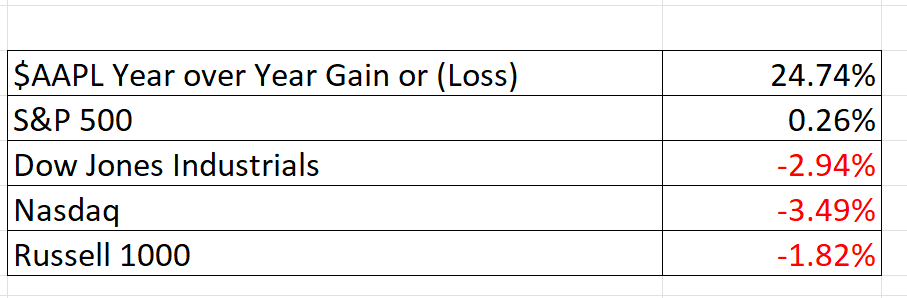
Regardless how you analyze it over whatever period you can see that $AAPL has massively outperformed the broader stock market indexes.
One of the huge secrets to picking your stocks is finding those assets which outperform all of the broader market indexes over all major crucial time frames. This is what has occurred in $AAPL over the last year.
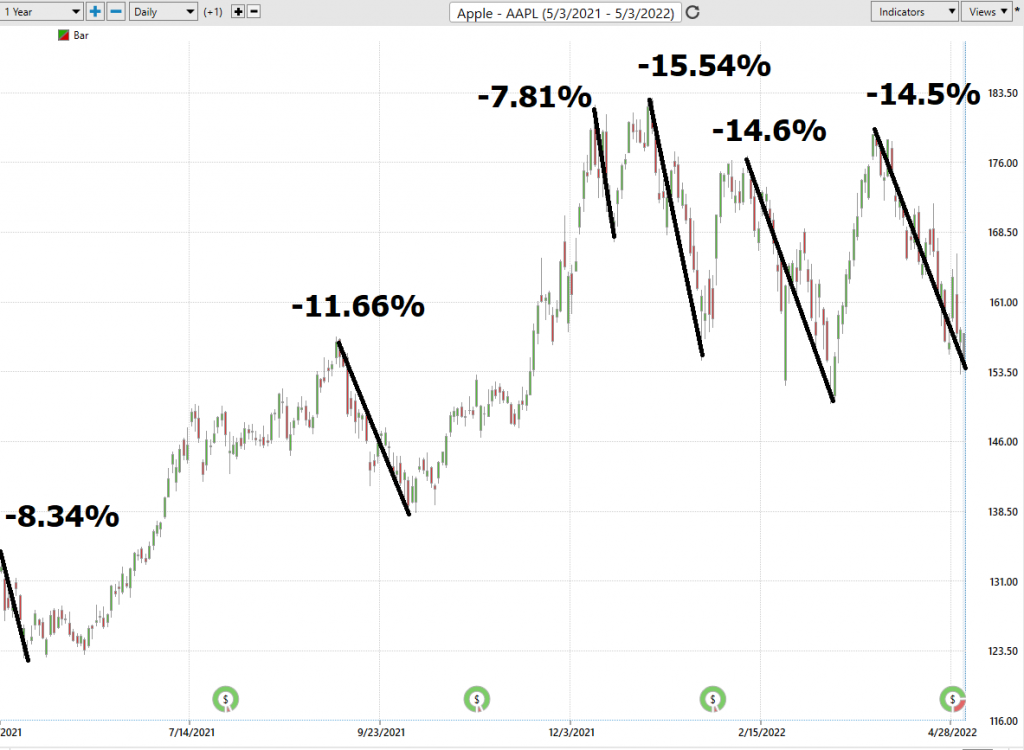
What were the worst-case drawdowns? The graphic below shows the bumpy ride. Observe how these drawdowns correlate directly to the annualized volatility value.
The Vantagepoint A.I. Analysis
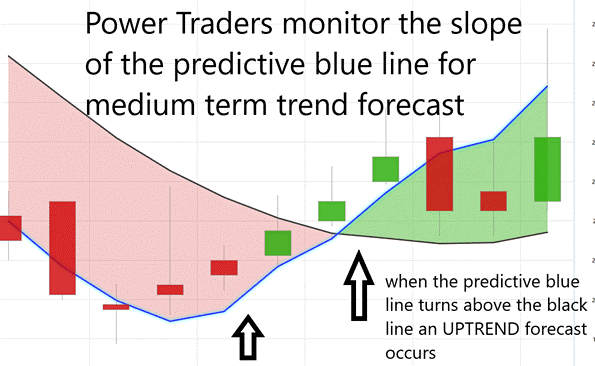
Using VantagePoint Software and the artificial intelligence, traders are alerted to trend forecasts by monitoring the slope of the predictive blue line. The black line is a simple 10 day moving average of price which simply tells you what has occurred in the market. The predictive blue line also acts as value zone where in uptrends traders try to purchase the asset at or below the blue line.
In studying the chart below, pay close attention to the relationship between the black line and predictive blue line. All that the black line tells you is what has occurred. It tells you where prices have been and what the average price over the last ten days is.
The predictive blue line, on the other hand utilizes that Vantagepoint patented Neural Network and Intermarket Analysis to arrive at its value. It looks at the strongest price drivers of an asset through artificial intelligence and statistical correlations to determine its value.
Whenever we see the predictive blue line move above the black line, we are presented with an UP-forecast entry opportunity.
Whenever the predictive blue line moves below the black line, we are presented with a DOWN forecast. More importantly, there is no guesswork involved. Traders know where the value zone and trend is at all times.
We are short term swing traders not long-term investors. We recognize that $AAPL is a Wall Street darling. But our philosophy is that our only loyalty is to the trend. Had you bought and held $AAPL over the last 6 months you would be up 5.64%. The problem with this metric is you can see how large the drawdowns were and how much profit was given back.
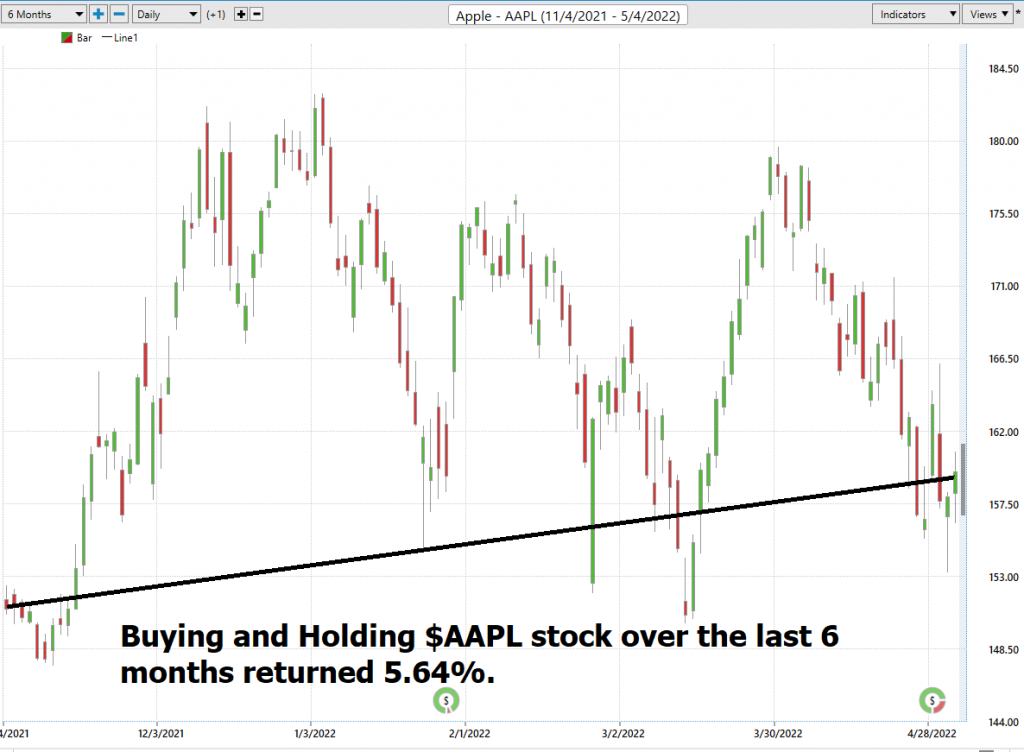
Using that buy-and-hold metric as a benchmark we look to amplify whenever we use the artificial intelligence. The chart below provides us with how Power Traders navigated the volatility in $AAPL stock.
In this analysis, we are using the most conservative Vantagepoint Long Tern Predictive Blue Line crossover.
Here is what the chart looks like.
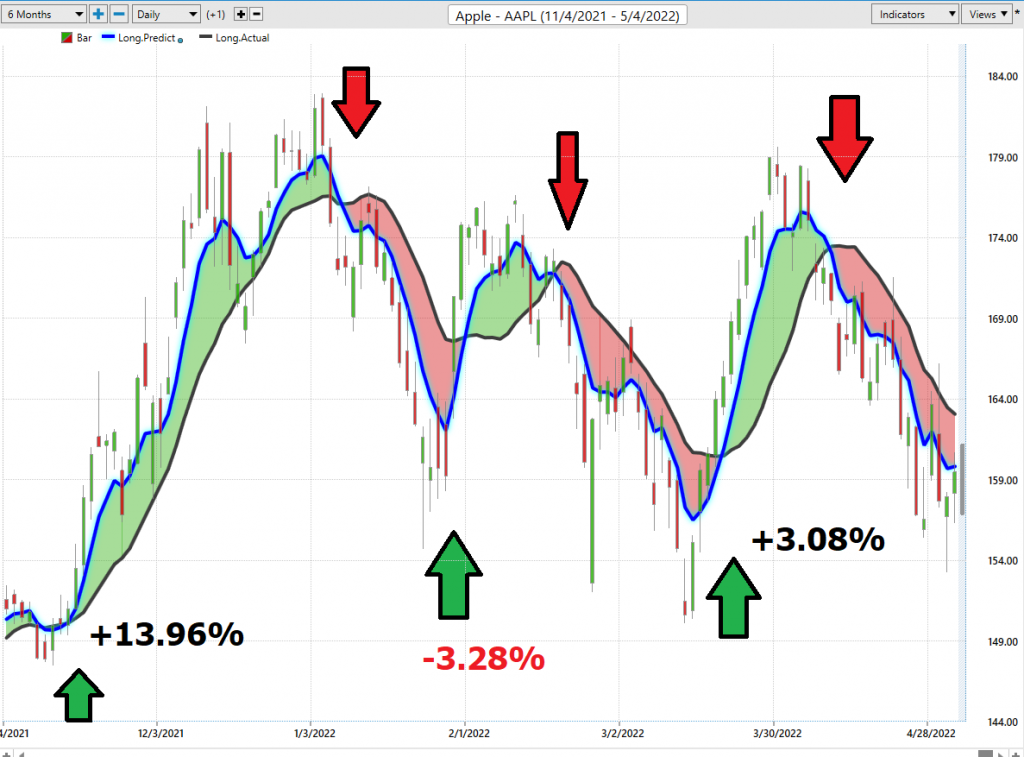
By only focusing on the UP forecasts in $AAPL stock over the last 6 months we had three opportunities.
#1 generated a winning return of 13.96%
#2 generated a loss of -3.28%
#3 generated a winning return of 3.08%
This generated a cumulative return over the last 6 months on $AAPL of 10.7% which is 89% greater than the buy and hold method.
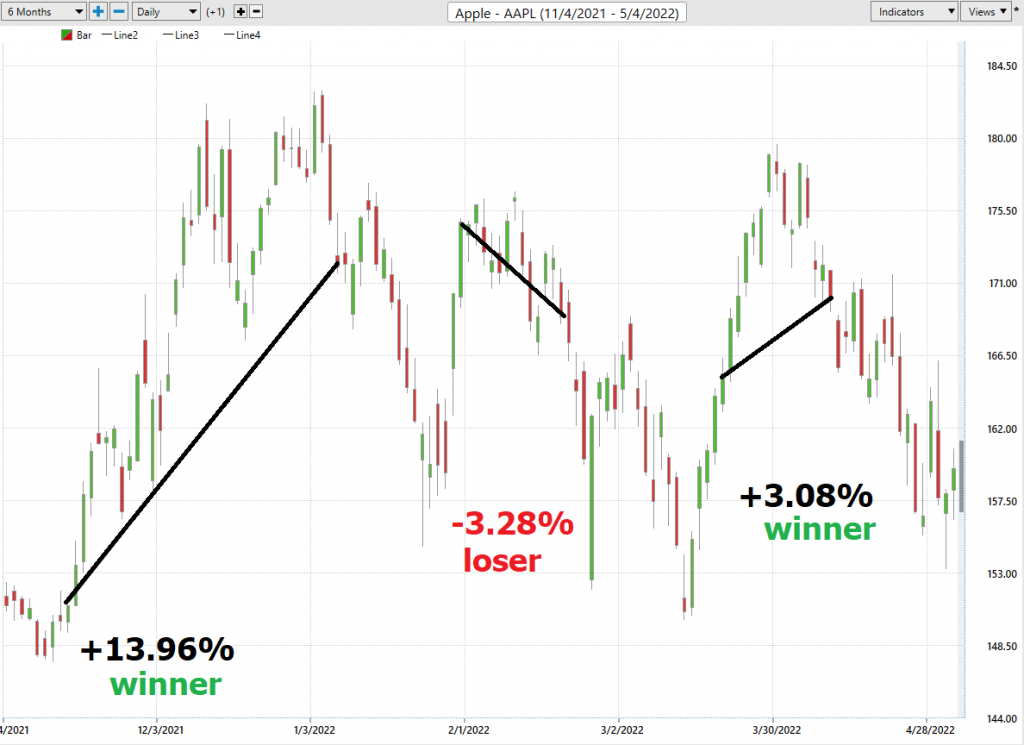
Here are the exact entries and exits on the charts. I include them separately, without the indicators, so you can see the entirety of the volatility.
Fine Tuning Entries with The Neural Net Indicator
At the bottom of the chart is the Neural Network Indicator which predicts future strength and/or weakness in the market. When the Neural Net Indicator is green it communicates strength. When the Neural Net is red it’s forecasting short-term weakness in the market.
We advocate that Power Traders cross reference the chart with the predictive blue line and neural network indicator to create optimal entry and exit points.
A Neural Net is a computational learning system that uses a network of functions to understand and translate massive amounts of data into a desired output, consistently monitoring itself and improving its performance.
Power Traders are always looking to apply both the neural network and A.I. to the markets to find statistically sound trading opportunities. We refer to this as a “double confirmation” setup and look for the predictive blue line to slope higher and to be confirmed by the Neural Net at the bottom of the chart.
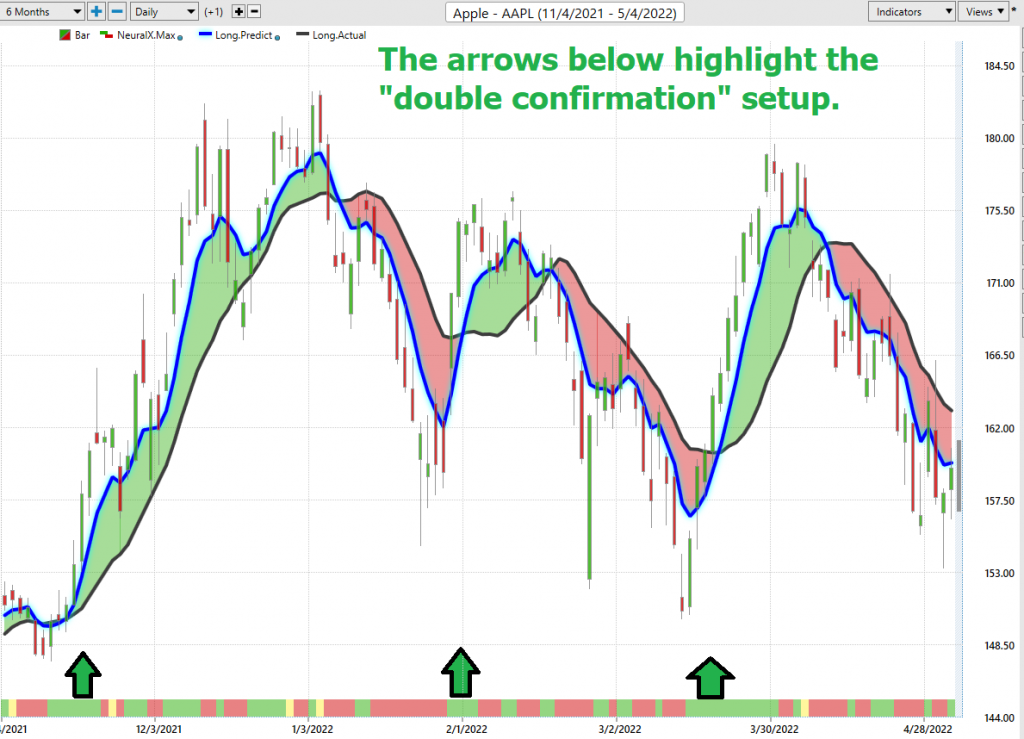
We advise Power Traders to cross reference the predictive blue line with the Neural Net for the best entry opportunities. Observe how the slope of the predictive blue line has remained positive from the time earnings were announced.
You can see in the chart above how the Neural Net offered several opportunities of double confirmation to Power Traders, when the predictive blue line and the Neural Net aligned with the same forecast. These instances provide extremely high probability trading opportunities to exploit the trend.
VantagePoint Software Daily Price Range Prediction
One of the powerful features in the Vantagepoint A.I. Software which Power Traders use daily is the Daily Price Range prediction forecast.
This forecast is what permits Power Traders to truly fine tune their entries and exits into the market.
What is the most important feature that traders are concerned about? Traders need to know where to enter and exit a market. VantagePoint provides this answer with exacting precision. Every day the Daily Range forecast is updated to provide insight into anticipated price action.
The purpose of all these indicators so far is to help traders stay on the right side of the right trend at the right time.
One of the powerful features in the Vantagepoint A.I. Software which Power Traders use daily is the Daily Price Range prediction forecast.
This forecast is what permits Power Traders to truly fine tune their entries and exits into the market, often looking for smaller time frames and more granular trading opportunities.
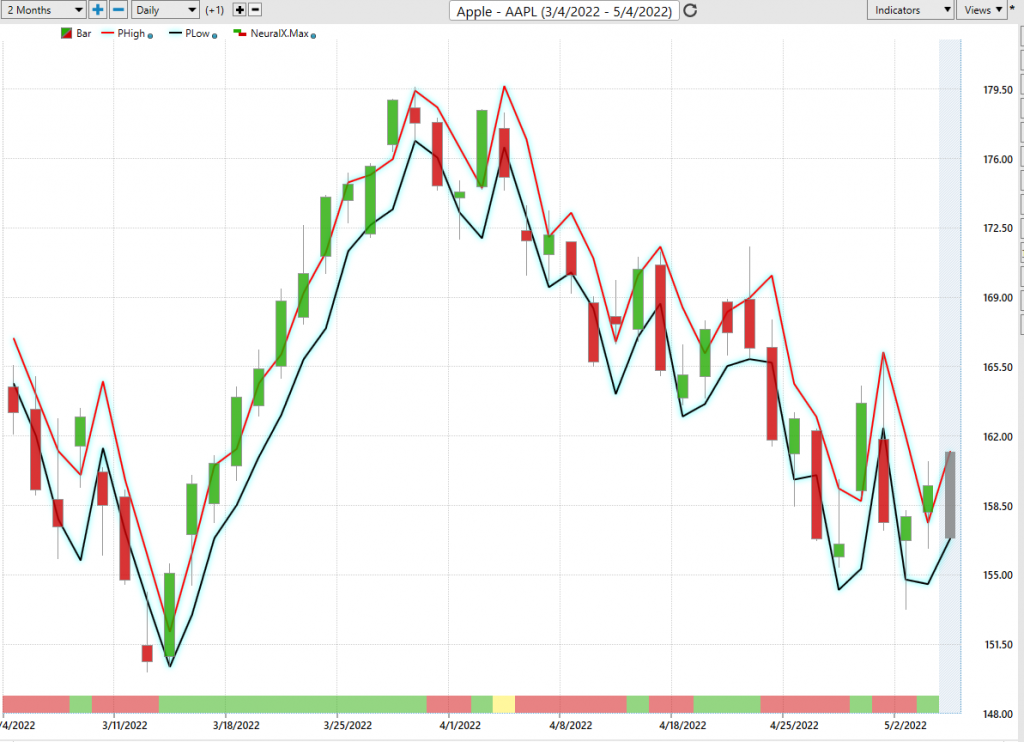
Here is the price chart of $AAPL during the most recent runup and drawdown featuring the Daily Price Range forecast and the Neural Net Indicator. Power Traders had numerous opportunities to short-term swing trade the trend by simply looking to purchase near the bottom of the predicted range and selling towards the top of the predictive range.
Intermarket Analysis
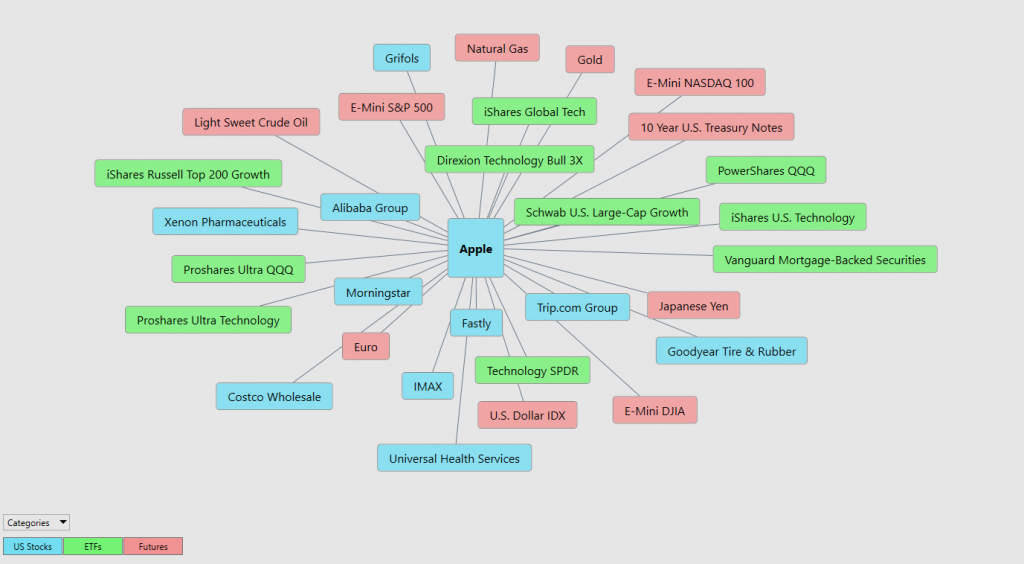
What makes the VantagePoint Software extraordinary is its capacity to perform Intermarket analysis and to find those assets which are most statistically interconnected and are the key drivers of price.
Studying the charts can always provide objective realities in terms of locating support and resistance levels which become clear on a chart. But we live in a global marketplace. Everything is interconnected. The billion-dollar question for traders is always what are the key drivers of price for the underlying asset that I am trading?
These intangibles are invisible to the naked eye yet show very high statistical correlations.
Slight changes in Interest rates, Crude Oil Prices, and the Volatility of the dollar amongst thousands of other variables affect the decisions companies must make to survive in these challenging times. Trying to determine what these factors are is one of the huge problems facing investors and traders.
There is terrific value to be had in studying and understanding the key drivers of $AAPL’s price action.
By doing so you can often see which ETFs are acquiring $AAPL as well as uncovering other industries which affect $AAPL price movement.
This can be invaluable information because it allows a trader to locate other opportunities and see a listing of the ETF’s that are also buyers of $AAPL. This knowledge is how other trading opportunities are often uncovered in their embryonic stages.
Suggestion
The performance metrics tell the entire story. Even after the substantial pullback that $AAPL has experienced it has offered a better store of value than other stocks.

We like the idea of looking for buying opportunities of $AAPL on dips and breaks which we expect to occur on a regular basis. Traditionally $AAPL stock does very well following its launches from its developer conferences. Apple has announced that June 6th is the next Apple developer conference, and we suspect that will provide tremendous support for the market.
$AAPL is currently in a downtrend and looking for a bottom.
Based upon its current volatility we think that moving below $152 is improbable but are watching that level closely.
Its next earnings call is August 1, 2022.
We will be focusing on buying opportunities over the coming days and waiting for a change in forecast from artificial intelligence.
Our advice: Follow the a.i. trend analysis and practice good money management on all your trades.
The chart looks cautious. on $AAPL.
We will re-evaluate this analysis based upon:
- Wall Street Analysts’ Estimates
- 52-week high and low boundaries
- Vantagepoint A.I. Forecast (Predictive Blue Line)
- Neural Network Forecast
- Daily Range Forecast
- Intermarket Analysis
Let’s Be Careful Out There!
Remember, It’s Not Magic.
It’s Machine Learning.

IMPORTANT NOTICE!
THERE IS SUBSTANTIAL RISK OF LOSS ASSOCIATED WITH TRADING. ONLY RISK CAPITAL SHOULD BE USED TO TRADE. TRADING STOCKS, FUTURES, OPTIONS, FOREX, AND ETFs IS NOT SUITABLE FOR EVERYONE.
DISCLAIMER: STOCKS, FUTURES, OPTIONS, ETFs AND CURRENCY TRADING ALL HAVE LARGE POTENTIAL REWARDS, BUT THEY ALSO HAVE LARGE POTENTIAL RISK. YOU MUST BE AWARE OF THE RISKS AND BE WILLING TO ACCEPT THEM IN ORDER TO INVEST IN THESE MARKETS. DON’T TRADE WITH MONEY YOU CAN’T AFFORD TO LOSE. THIS ARTICLE AND WEBSITE IS NEITHER A SOLICITATION NOR AN OFFER TO BUY/SELL FUTURES, OPTIONS, STOCKS, OR CURRENCIES. NO REPRESENTATION IS BEING MADE THAT ANY ACCOUNT WILL OR IS LIKELY TO ACHIEVE PROFITS OR LOSSES SIMILAR TO THOSE DISCUSSED ON THIS ARTICLE OR WEBSITE. THE PAST PERFORMANCE OF ANY TRADING SYSTEM OR METHODOLOGY IS NOT NECESSARILY INDICATIVE OF FUTURE RESULTS. CFTC RULE 4.41 – HYPOTHETICAL OR SIMULATED PERFORMANCE RESULTS HAVE CERTAIN LIMITATIONS. UNLIKE AN ACTUAL PERFORMANCE RECORD, SIMULATED RESULTS DO NOT REPRESENT ACTUAL TRADING. ALSO, SINCE THE TRADES HAVE NOT BEEN EXECUTED, THE RESULTS MAY HAVE UNDER-OR-OVER COMPENSATED FOR THE IMPACT, IF ANY, OF CERTAIN MARKET FACTORS, SUCH AS LACK OF LIQUIDITY. SIMULATED TRADING PROGRAMS IN GENERAL ARE ALSO SUBJECT TO THE FACT THAT THEY ARE DESIGNED WITH THE BENEFIT OF HINDSIGHT. NO REPRESENTATION IS BEING MADE THAT ANY ACCOUNT WILL OR IS LIKELY TO ACHIEVE PROFIT OR LOSSES SIMILAR TO THOSE SHOWN.

