
Avis is an American car rental company headquartered in Parsippany, New Jersey. Avis, Budget Rent a Car, Budget Truck Rental, and Zipcar are all units of Avis Budget Group. Avis Budget Group operates the Avis brand in South Africa, North America, South America, India, Australia, and New Zealand.
Last week in the Consumer Price Index release one of the startling statistics was that the price of Used Cars has gone up by 41% year over year, and New Cars increased in price by 12.9%. Since rental car companies usually keep their fleets for about 2 years before wholesaling it is very possible that the incredible increase in used car prices has contributed towards AVIS’s earnings and profitability.
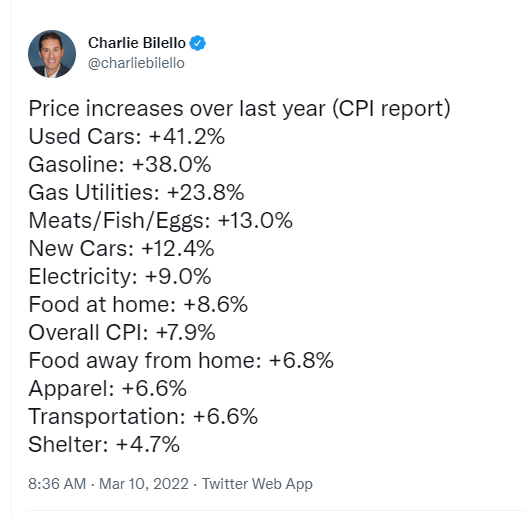
While we cannot verify that this is in fact the case for stronger earnings it is my strong suspicion that these increased prices in used cars are contributing strongly to the $CAR bottom line. The way I look at it, is imagine buying a car for $25,000, utilizing it for a few years and then selling it for about the same price or more than what you purchased it for.
Industry analysts claim that $CAR has benefited from changes in legislation in many states that allow rental car companies to charge extra for an additional driver. Over the past year $CAR crushed earnings estimates by 98% surprising even the most optimistic Wall Street analysts.
Shares of Avis Budget Group (NASDAQ: CAR)have taken investors and traders on a very profitable roller-coaster ride in the last 24 months. The stock fell from a high of $52.98 in February 2020 to $11 in March 2020 as the COVID-19 pandemic, and economic lockdown decimated the rental car industry.
Right now, a single share of Avis Budget Group is priced at almost $231.63, which means it has gained 2,057% in the last 22 months.
But these types of historical gains should not matter much to current investors. Let’s dig into the artificial intelligence, neural network and intermarket analysis to see whether $CAR is something you should have on your radar.
In this weekly stock study, we will look at and analyze the following indicators and metrics as are our guidelines which dictate our behavior on a particular stock.
- Wall Street Analysts’ Estimates
- 52-week high and low boundaries
- Best Case – Worst Case Analysis
- Vantagepoint A.I. Forecast (Predictive Blue Line)
- Neural Network Forecast
- Daily Range Forecast
- Intermarket Analysis
- Our trading suggestion
We don’t base our decisions on things like earnings or fundamental cash flow valuations. However, we do look at them to better understand the financial landscape that a company is operating under.
Analysts Ratings
The first set of boundaries which we explore in our stock study is what do the professionals think who monitor the stock for a living. We can acquire this information by simply looking at the boundaries that the top Wall Street Analysts set for $CAR. This initial set of boundaries provides us with an idea of what is expensive, fairly valued, and cheap.
Based on 6 Wall Street analysts offering 12-month price targets for Avis Budget in the last 3 months. The average price target is $195.00 with a high forecast of $260.00 and a low forecast of $164.00. The average price target represents a -15.81% change from the last price of $231.63.
From this simple analysis we can see that $CAR is above fair value at present time.
52-week High-Low Chart
Where the rubber meets the road as far as analysis is concerned is looking at the charts and evaluating where the asset stands in relation to its 52-week highs. As counterintuitive as it may sound, great stocks tend to consistently make new 52-week highs.
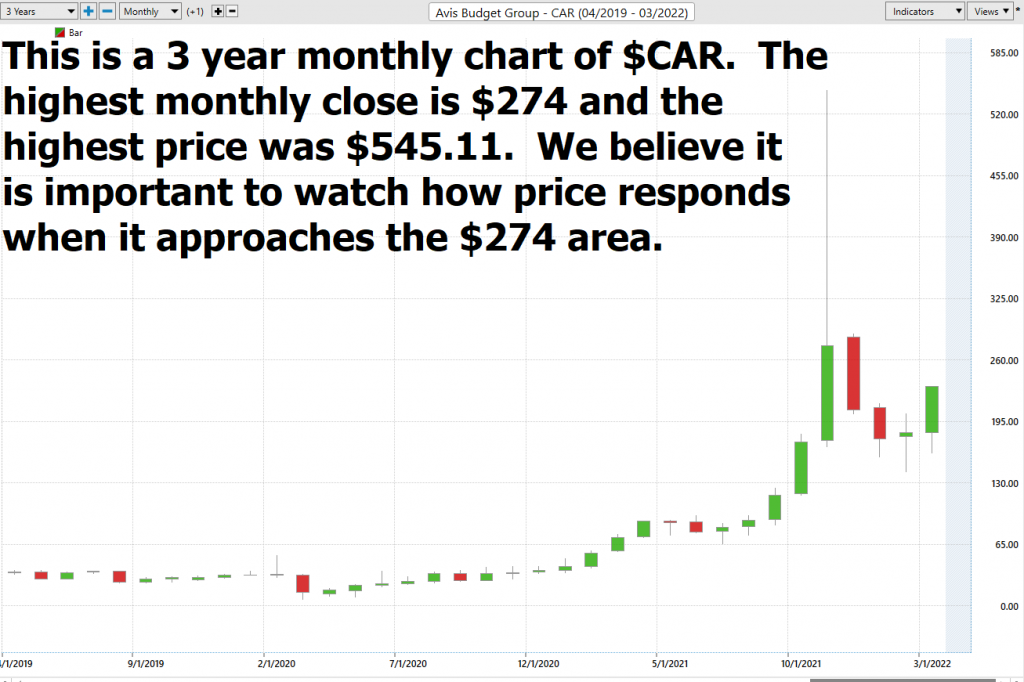
One of the simplest ways to evaluate a stock is to look at some long term monthly and weekly charts to be able to zoom out and see the big picture of the trend. Some of the greatest traders in the world use the longer-term monthly charts to determine trend analysis.
Here is the 3-year monthly chart of $CAR.
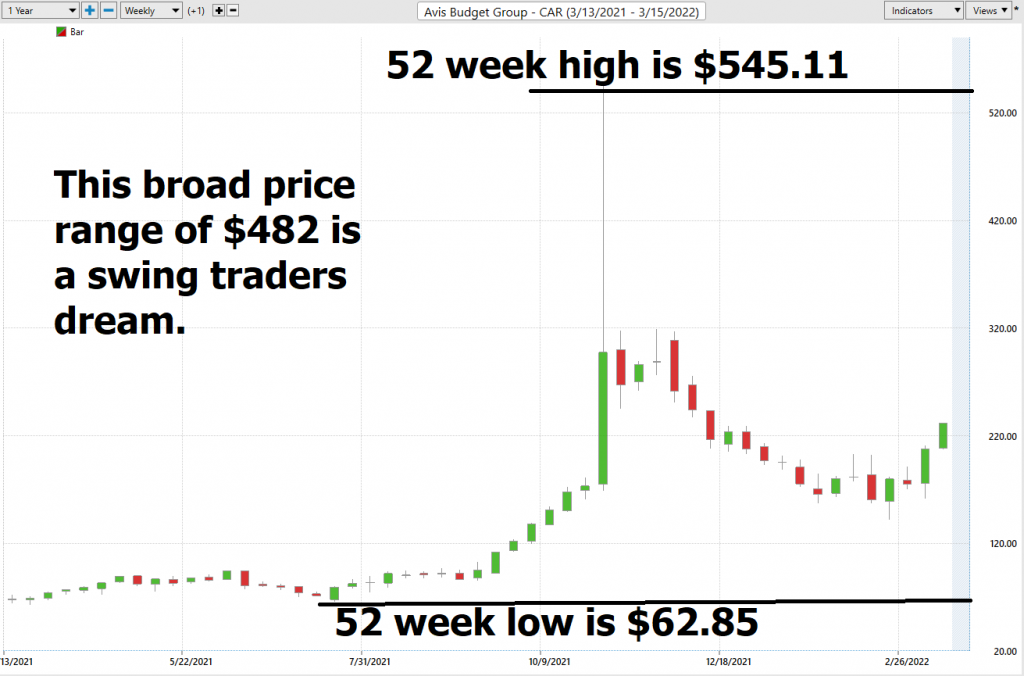
Whenever we trade, we always pay attention to where we are in relation to the 52-week trading range. It is quite common to see the 52-week high provide very strong resistance to the market until it is breached. Often when the 52-week high is breached we will see the stock price explode higher very quickly over a very short period.
$CAR has traded as high as $545.11 and as low as $62.85 over the last 52 weeks. Its annual trading range has been $482.26 which means that its average weekly trading range has been $9.27.
We also like to take the annual trading range of $882.26 and divide it by the current price of $231.62 to calculate a broad-based measure of volatility. This tells us that the current volatility is 208% which tells us that future expectations and risk is considered very high. We should expect very broad swings in $CAR moving forward.
We have learned from years and years of observation, that stocks which breach their 52-week highs multiple times a year are often in strong trends which we want to be aware of. The 52-week boundary often acts as significant resistance in thwarting trends.
You can observe that as $CAR was making new 52-week highs every week until it had the massive blow off top exhaustion candle. Prices have now sold off and consolidated. We must pay attention to the highest weekly and monthly closes on the chart and observe how price reacts to those ranges.
Best Case – Worst Case Analysis
Next, we want to evaluate $CAR is in comparison to the performance of the major stock market indexes which we have greater familiarity with and then look at the drawdowns of the stock over the past year to get a worst-case scenario idea for any conclusions that we might reach when we trade this asset.
- Over the past year $CAR is up 226.56%.
- The Dow Jones Industrials are up 3.56% over the past year.
- S&P 500 is UP 9.25% over the last year.
- Russell 1000 Small Cap is up 5.87 % in the past year.
- The NASDAQ is up 18.57%
You can see $CAR performed substantially better than the broader market indexes. Rest assured that Wall Street traders and investors are also very aware of this and they will start rotating out of the broader market indexes to chase yield in a risk-managed fashion.
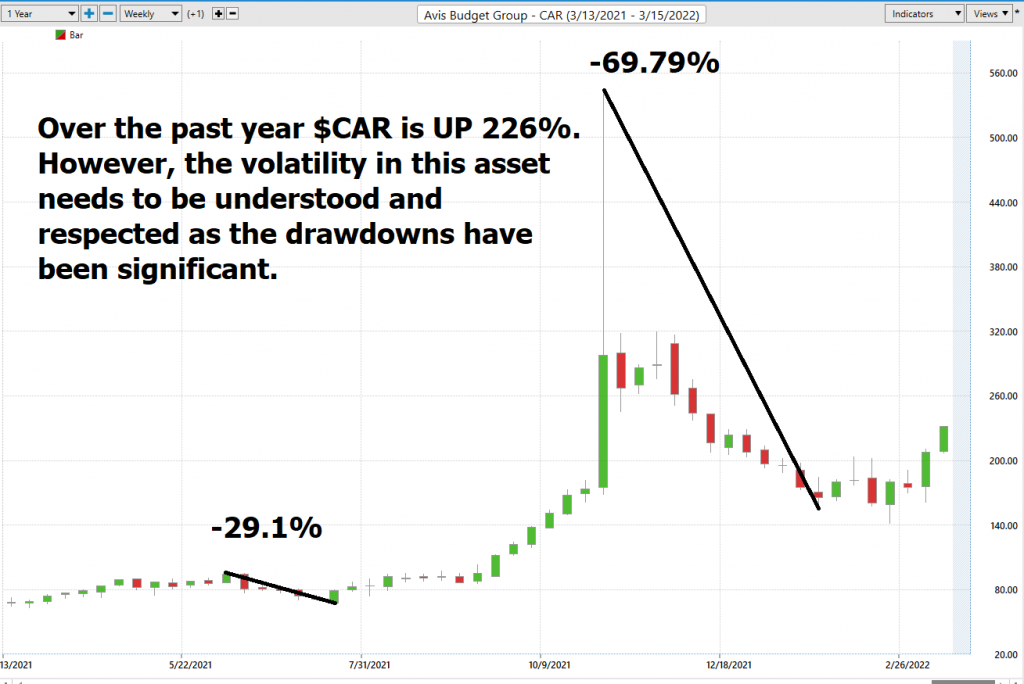
We would expect this type of volatility to continue. This means that traders should anticipate wild swings in the market and pay attention to the a.i. forecast when we hit large drawdown levels from recent peaks.
The Vantagepoint A.I. Analysis
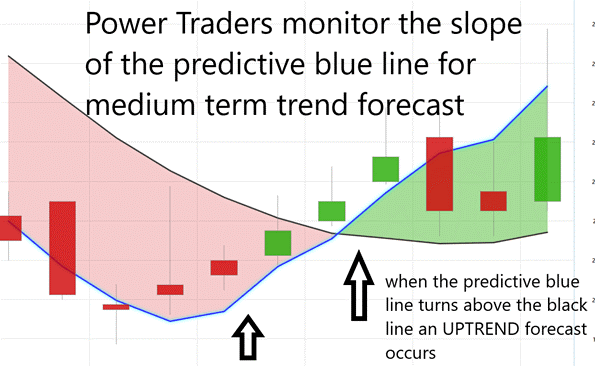
Using VantagePoint Software and the artificial intelligence, traders are alerted to trend forecasts by monitoring the slope of the predictive blue line. The black line is a simple 10 day moving average of price which simply tells you what has occurred in the market. The predictive blue line also acts as value zone where in uptrends traders try to purchase the asset at or below the blue line.
In studying the chart below, pay close attention to the relationship between the black line and predictive blue line. All that the black line tells you is what has occurred. It tells you where prices have been and what the average price over the last ten days is.
The predictive blue line, on the other hand utilizes that Vantagepoint patented Neural Network and Intermarket Analysis to arrive at its value. It looks at the strongest price drivers of an asset through artificial intelligence and statistical correlations to determine its value.
The a.i. provided an UP forecast on 3/1/22 at $180.30 per share. In 2 short weeks prices have rallied to over 23%.
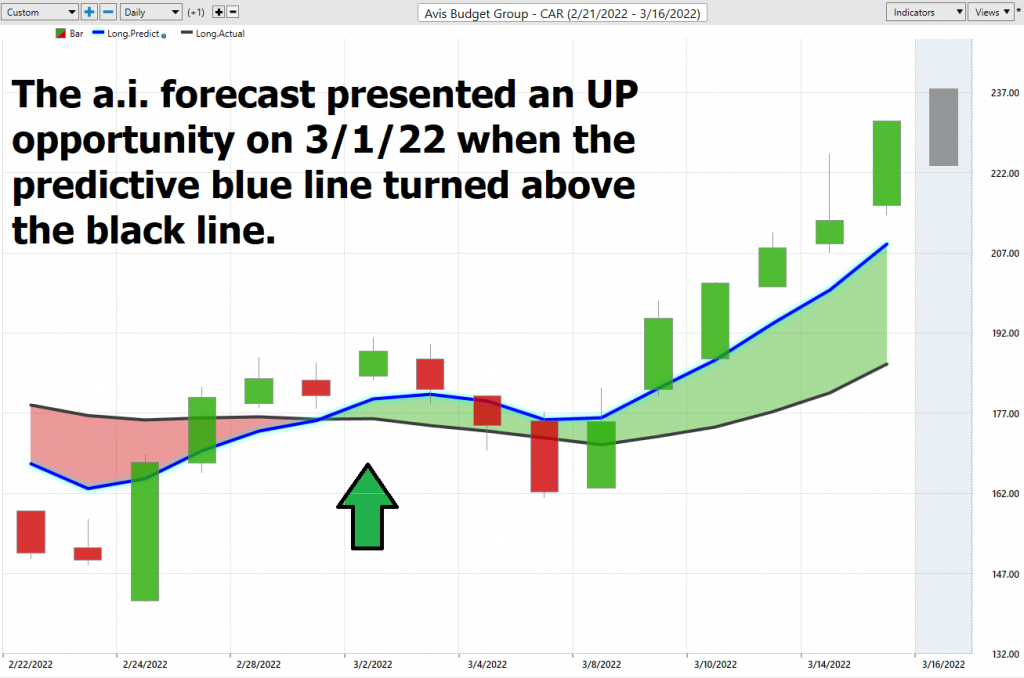
Whenever we see the predictive blue line move above the black line, we are presented with an UP-forecast entry opportunity. These are highlighted by UP arrows on the chart.
Whenever the predictive blue line moves below the black line, we are presented with a DOWN forecast. More importantly, there is no guesswork involved. Traders know where the value zone and trend are at all times.
Fine Tuning Entries with The Neural Net Indicator
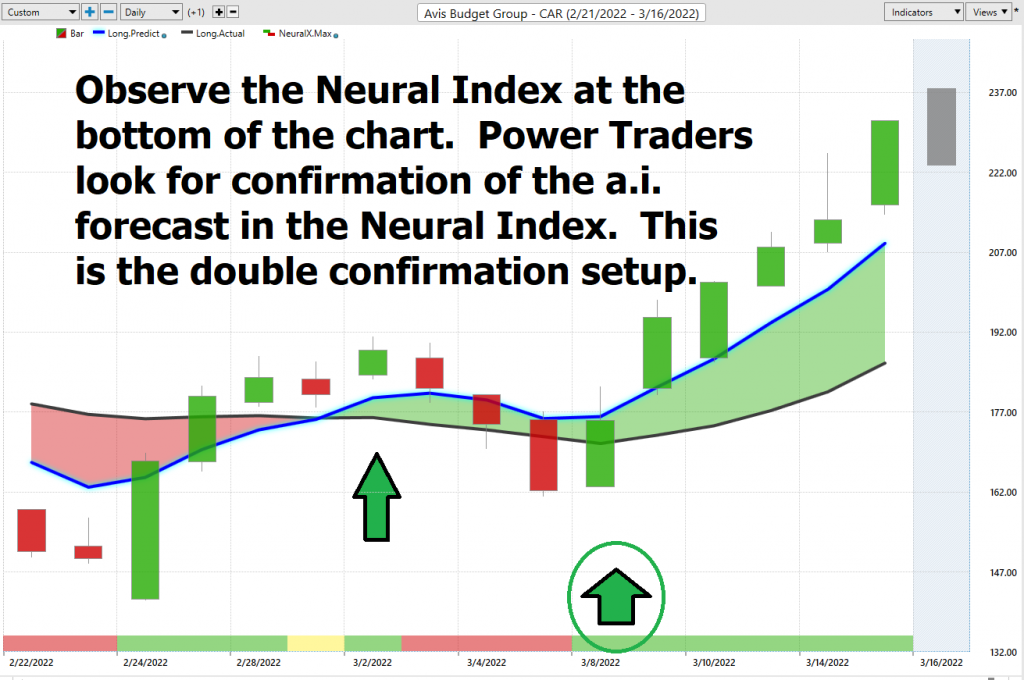
At the bottom of the chart is the Neural Network Indicator which predicts future strength and/or weakness in the market. When the Neural Net Indicator is green it communicates strength. When the Neural Net is red it’s forecasting short term weakness in the market.
We advocate that Power Traders cross reference the chart with the predictive blue line and neural network indicator to create optimal entry and exit points.
A Neural Net is a computational learning system that uses a network of functions to understand and translate massive amounts of data into a desired output, consistently monitoring itself and improving its performance. Power Traders are always looking to apply both the neural network and A.I. to the markets to find statistically sound trading opportunities. We refer to this as a “double confirmation” setup and look for the predictive blue line to slope higher and to be confirmed by the Neural Net at the bottom of the chart.
We advise Power Traders to cross reference the predictive blue line with the Neural Net for the best entry opportunities. Observe how the slope of the predictive blue line has remained positive from the time earnings were announced.
You can see in the chart above how the Neural Net offered several opportunities of double confirmation to Power Traders, when the predictive blue line and the Neural Net aligned with the same forecast. These instances provide extremely high probability trading opportunities to exploit the trend.
VantagePoint Software Daily Price Range Prediction
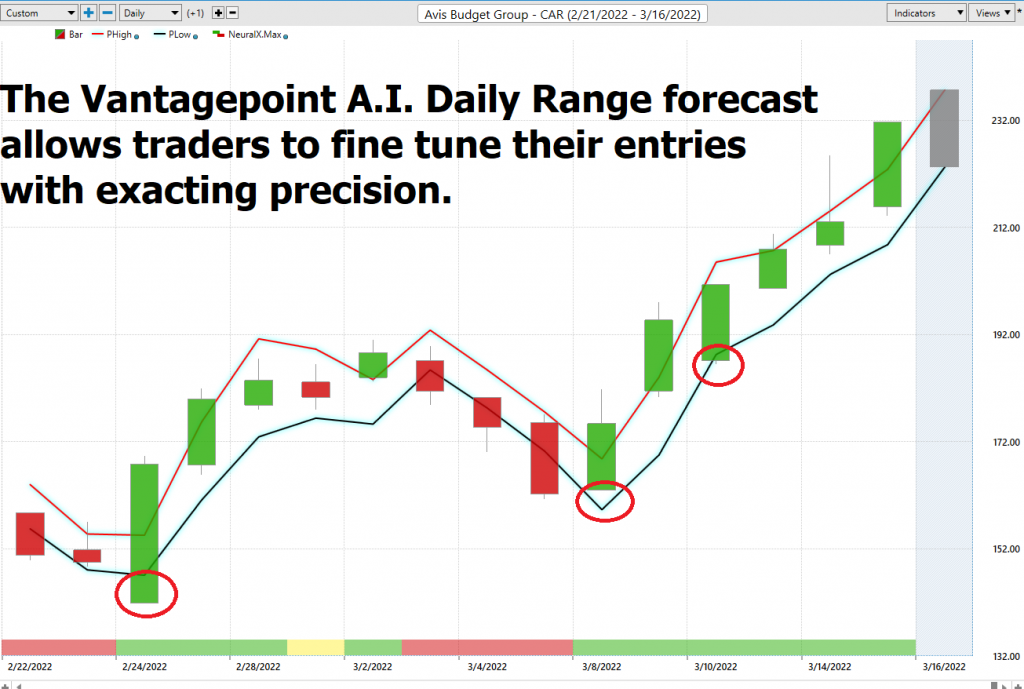
One of the powerful features in the Vantagepoint A.I. Software which Power Traders use daily is the Daily Price Range prediction forecast.
This forecast is what permits Power Traders to truly fine tune their entries and exits into the market. What is the most important feature that traders are concerned about? Traders need to know where to enter and exit a market. VantagePoint provides this answer with
exacting precision. Every day the Daily Range forecast is updated to provide insight to anticipated price action.
By cross-referencing the double confirmation setup with the daily range forecast Power Traders are alerted to swing trading opportunities with exacting precision.
Intermarket Analysis
What makes the Vantagepoint Software extraordinary is its capacity to perform Intermarket analysis and to find those assets which are most statistically interconnected and are the key drivers of price.
Studying the charts can always provide objective realities in terms of locating support and resistance levels which become truly clear on a chart. But we live in a global marketplace. Everything is interconnected. The billion-dollar question for traders is always what are the key drivers of price for the underlying asset that I am trading?
These intangibles are invisible to the naked eye yet show extremely high statistical correlations.
Small changes in Interest rates, Crude Oil Prices, and the Volatility of the dollar amongst thousands of other variables affect the decisions companies must make to survive in these very challenging times. Trying to determine what these factors are is one of the huge problems facing investors and traders.
There is excellent value to be had in studying and understanding the key drivers of $CAR’s price action.
By doing so you can often see which ETFs are most likely acquiring $CAR as well as uncovering other industries which affect $CAR price movement.
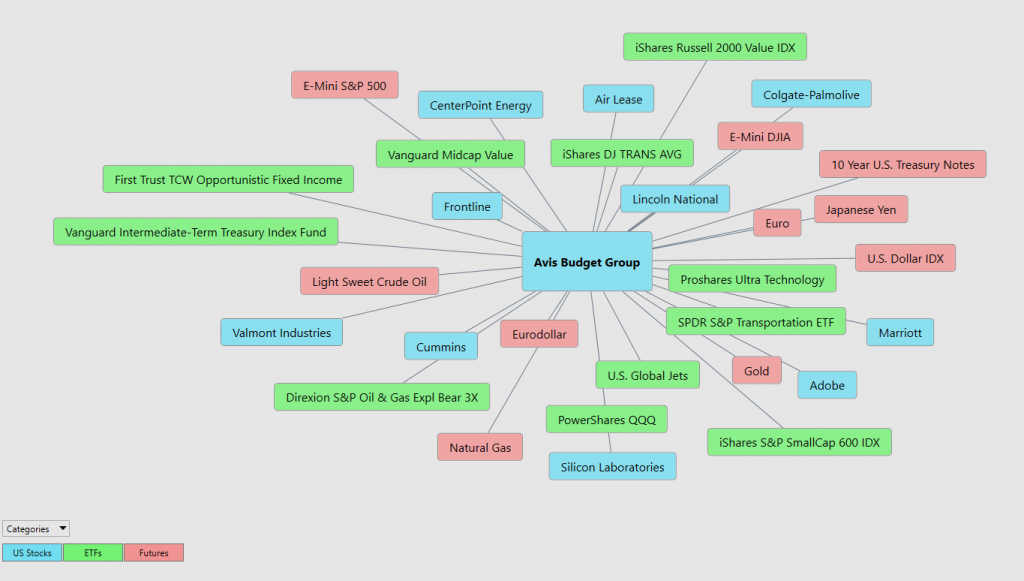
This can be invaluable information because it allows a trader to locate other opportunities and see a listing of the ETF’s that are also buyers of $CAR. This knowledge is how other trading opportunities are often uncovered in their embryonic stages.
Suggestion
The trend is UP.
Momentum is UP. The stock is overvalued.
The reality that this stock has beat the performance of the S&P 500 by over 23-fold. We think this trend will continue.
However, we want to stress that we are not long-term investors we focus on the short term and on allowing a.i. to guide our decision making process.
The markets are extremely nervous and tense about any Federal Reserve interest rate actions. Should the Fed raise interest rates we will see incredible volatility and $CAR will certainly exhibit wild swings.
With huge volatility come huge option premiums. Two opportunities present themselves for savvy options traders.
The first is a covered call purchase where one buys the stock and sells one call option and collect the premium.
The second is to use any sharp breaks in price to sell put options and collect the premium.
We like the idea of looking for buying opportunities of $CAR on dips and breaks which we expect to occur on a regular basis.
The predictive blue line is the guidance that we will be following.
Our advice: Follow the a.i. trend analysis and practice good money management on all your trades.
CAR deserves to be on your radar. It might take several months to unfold but if it makes a new closing high, we think it will run substantially higher very quickly. Since we are trading 15% under the highest monthly close, we suggest you watch that level on this stock very closely.
We will re-evaluate this analysis based upon:
- Wall Street Analysts’ Estimates
- 52-week high and low boundaries
- Vantagepoint A.I. Forecast (Predictive Blue Line)
- Neural Network Forecast
- Daily Range Forecast
- Intermarket Analysis
Let’s Be Careful Out There!
Remember, It’s Not Magic.
It’s Machine Learning.

IMPORTANT NOTICE!
THERE IS SUBSTANTIAL RISK OF LOSS ASSOCIATED WITH TRADING. ONLY RISK CAPITAL SHOULD BE USED TO TRADE. TRADING STOCKS, FUTURES, OPTIONS, FOREX, AND ETFs IS NOT SUITABLE FOR EVERYONE.
DISCLAIMER: STOCKS, FUTURES, OPTIONS, ETFs AND CURRENCY TRADING ALL HAVE LARGE POTENTIAL REWARDS, BUT THEY ALSO HAVE LARGE POTENTIAL RISK. YOU MUST BE AWARE OF THE RISKS AND BE WILLING TO ACCEPT THEM IN ORDER TO INVEST IN THESE MARKETS. DON’T TRADE WITH MONEY YOU CAN’T AFFORD TO LOSE. THIS ARTICLE AND WEBSITE IS NEITHER A SOLICITATION NOR AN OFFER TO BUY/SELL FUTURES, OPTIONS, STOCKS, OR CURRENCIES. NO REPRESENTATION IS BEING MADE THAT ANY ACCOUNT WILL OR IS LIKELY TO ACHIEVE PROFITS OR LOSSES SIMILAR TO THOSE DISCUSSED ON THIS ARTICLE OR WEBSITE. THE PAST PERFORMANCE OF ANY TRADING SYSTEM OR METHODOLOGY IS NOT NECESSARILY INDICATIVE OF FUTURE RESULTS. CFTC RULE 4.41 – HYPOTHETICAL OR SIMULATED PERFORMANCE RESULTS HAVE CERTAIN LIMITATIONS. UNLIKE AN ACTUAL PERFORMANCE RECORD, SIMULATED RESULTS DO NOT REPRESENT ACTUAL TRADING. ALSO, SINCE THE TRADES HAVE NOT BEEN EXECUTED, THE RESULTS MAY HAVE UNDER-OR-OVER COMPENSATED FOR THE IMPACT, IF ANY, OF CERTAIN MARKET FACTORS, SUCH AS LACK OF LIQUIDITY. SIMULATED TRADING PROGRAMS IN GENERAL ARE ALSO SUBJECT TO THE FACT THAT THEY ARE DESIGNED WITH THE BENEFIT OF HINDSIGHT. NO REPRESENTATION IS BEING MADE THAT ANY ACCOUNT WILL OR IS LIKELY TO ACHIEVE PROFIT OR LOSSES SIMILAR TO THOSE SHOWN.

